
- XRP’s price increased by more than 12% in the last seven days.
- Most metrics and market indicators looked bearish on the token.
XRP showcased a promising rally last week as its price registered double-digit growth last week. The better news was that things could get even more bullish in the coming weeks as the token was on the verge of breaking above a long-term bullish pattern.
XRP’s multi-year bullish pattern
CoinMarketCap’s data revealed that XRP bulls controlled the market last week as its price increased by more than 12% in the past seven days.
At the time of writing, the token was trading at $0.5948 with a market capitalization of over $33 billion, making it the seventh largest crypto. In the meantime, the token was getting ready to break out of a multi-year bullish pattern.
Milkybull, a popular crypto analyst, posted a tweet revealing a 6-year-long bullish pennant pattern on its price chart. As per the tweet, the pattern emerged on XRP’s chart in 2018–2019 and since then has been consolidating inside it.
At press time, it was on the verge of breaking out. In the event of a breakout, the token might begin yet another bull rally. In fact, the possible bull rally could push XRP to an all-time high over the coming weeks or months.

Source: X
Will XRP finally breakout?
AMBCrypto then planned to have a look at the token’s on-chain data to see whether they suggested a possible breakout anytime soon.
Our analysis of Santiment’s data revealed that XRP’s supply on exchanges dropped. This clearly meant that investors were increasing their accumulation.
However, the rest of the metrics looked pretty bearish. For example, the token’s MVRV ratio declined over the last week. Its trading volume also dropped, which suggested that the on-going bullish price trend might not last.
Additionally, XRP’s whale transaction count also declined, hinting that whales were not actively trading the token. Another bearish metric was the fear and greed index, as at press time it had a reading of 69%.
This meant that the market was in a “greed” phase, which often results in price corrections.
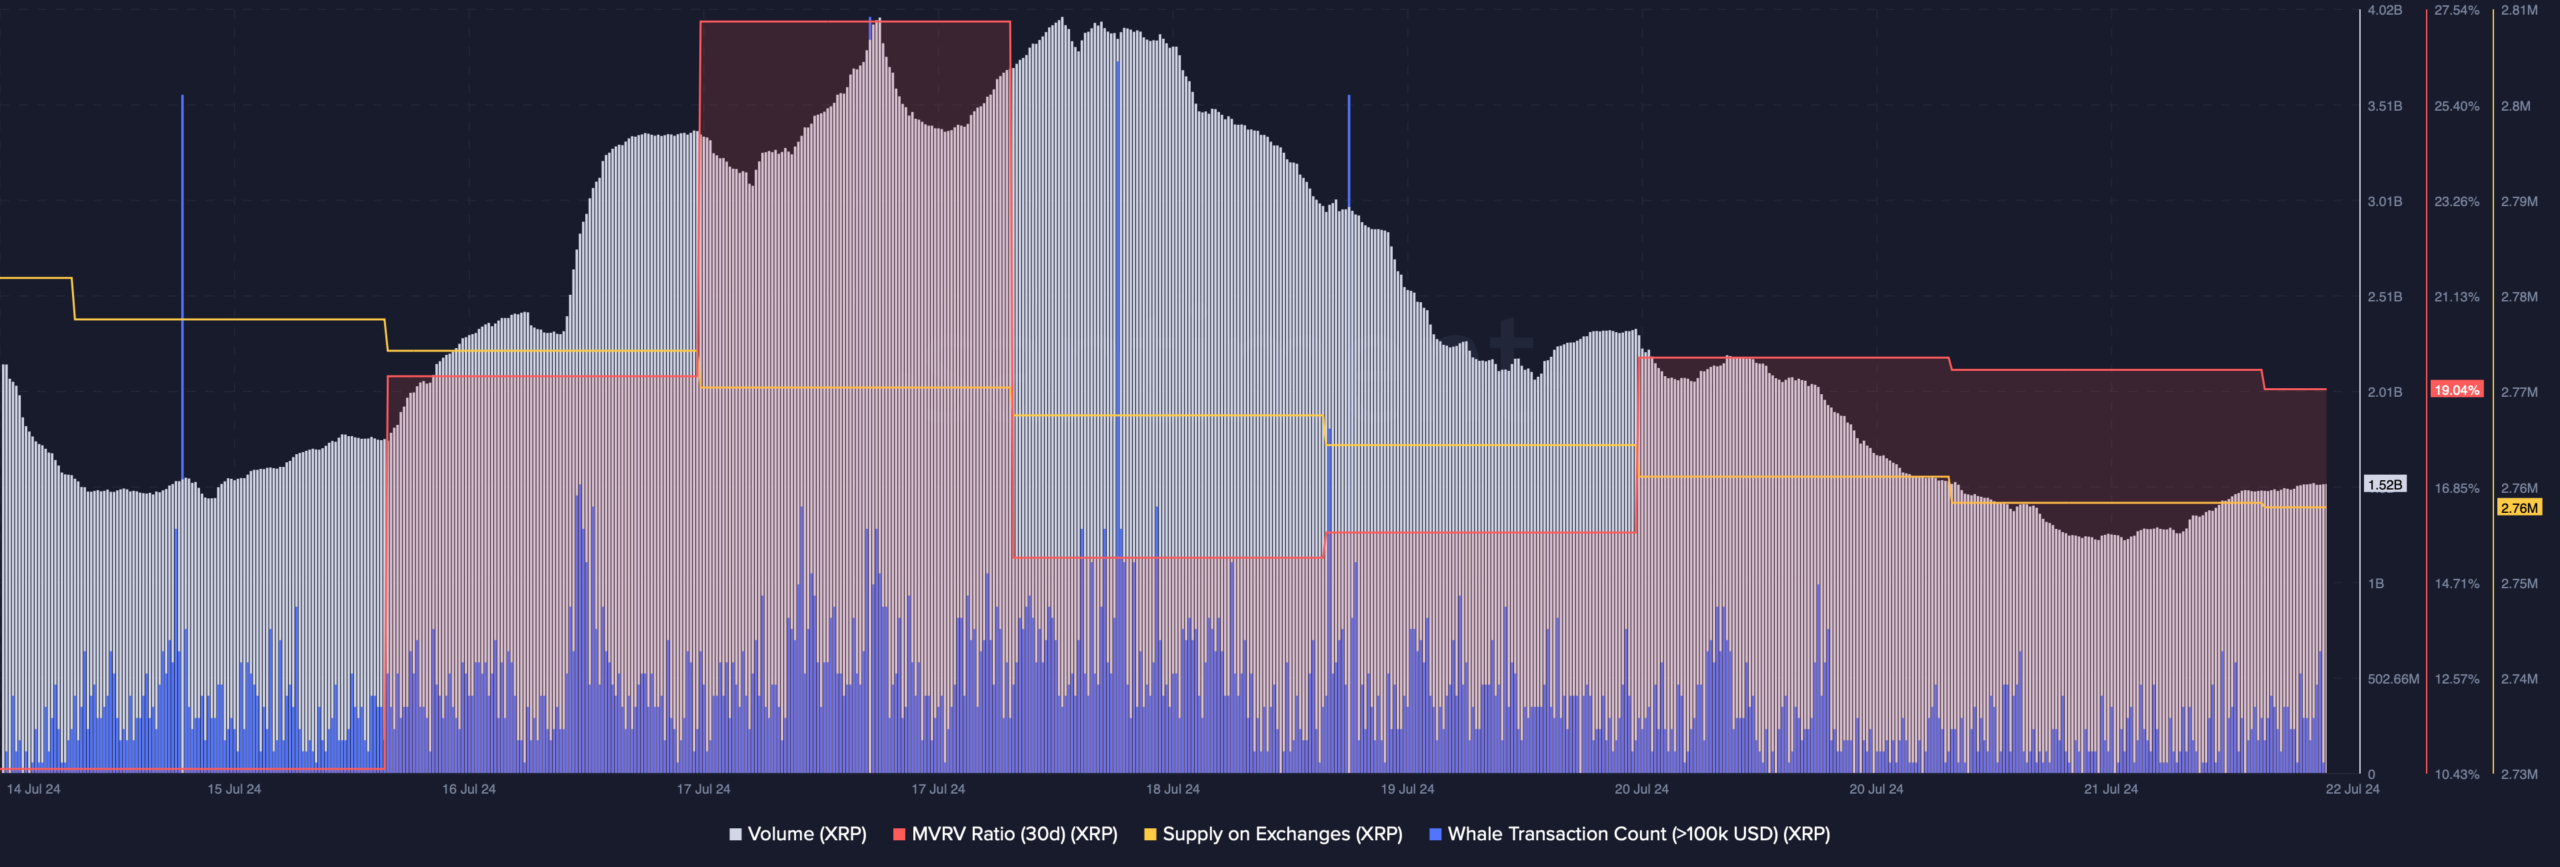
Source: Santiment
We then took a look at the token’s daily chart. We found that the Money Flow Index (MFI) was about to enter the overbought zone, which might result in an increase in selling pressure over the coming days.
Read Ripple’s [XRP] Price Prediction 2024-25
Additionally, its Chaikin Money Flow (CFM) also registered a slight downtick. These indicators suggested that it might take longer for XRP to breakout.
Nonetheless, the MACD remained in the favor of bulls.
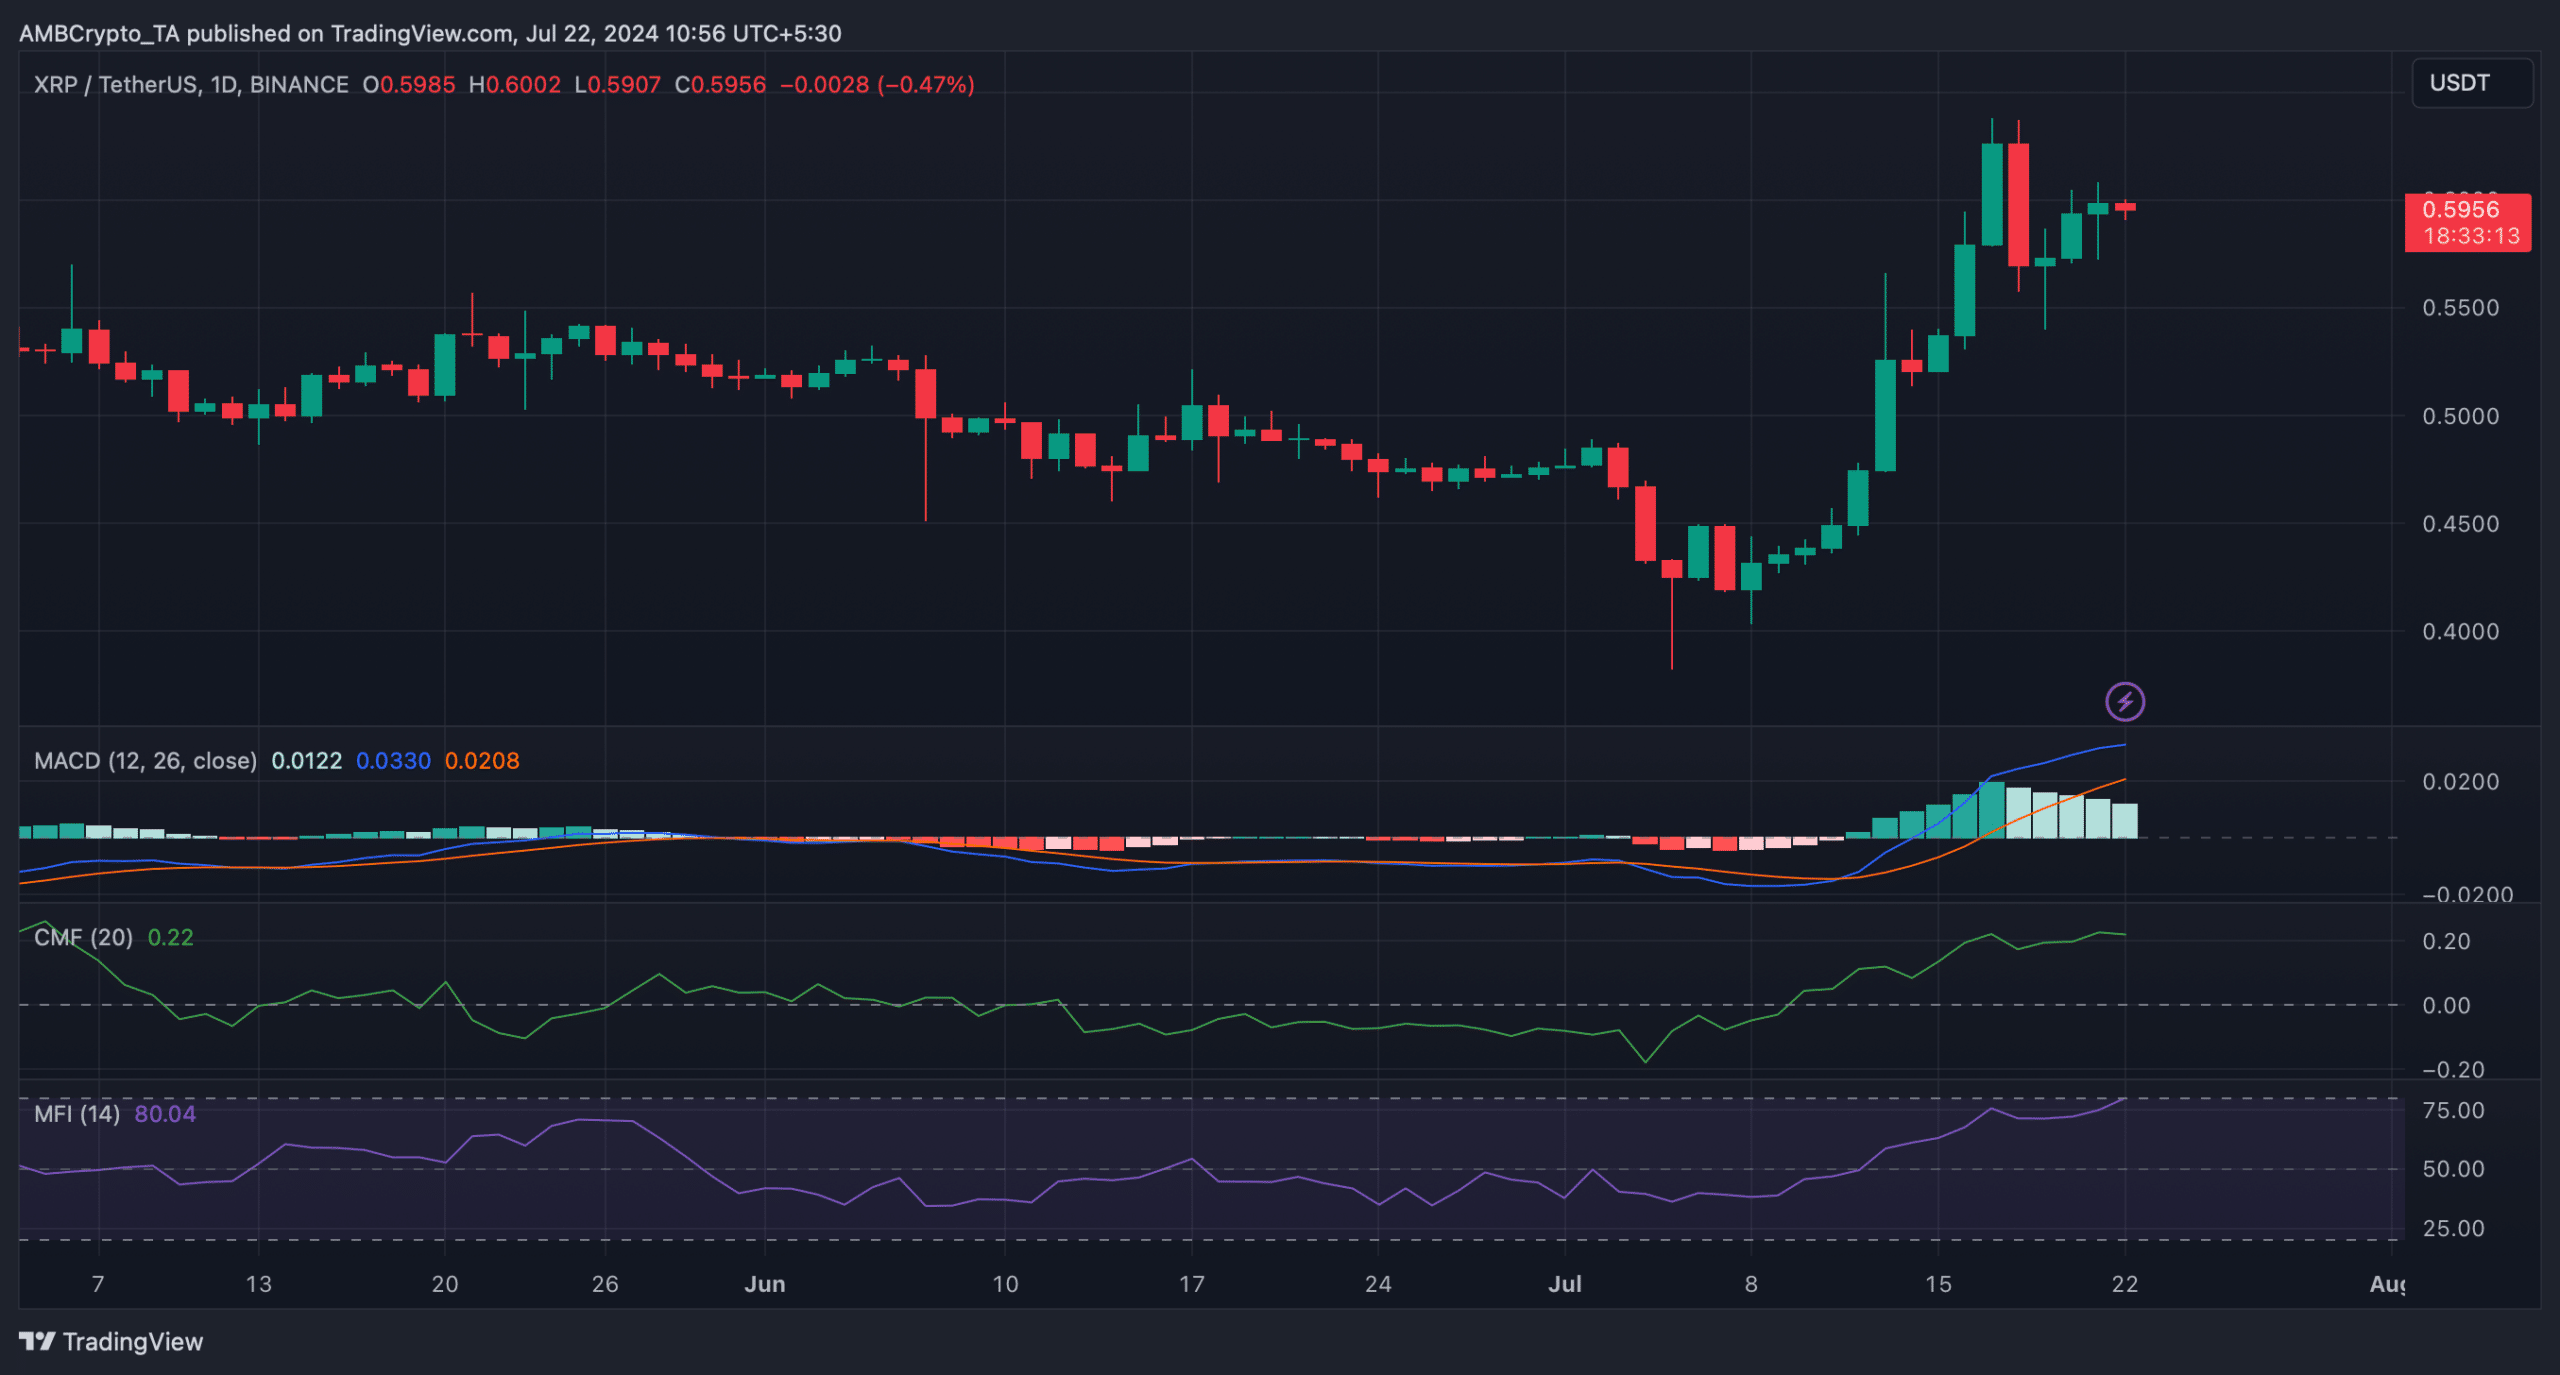
Source: TradingView


