XRP, MANA, The Sandbox Price Analysis: 19 December

As the ‘fear’ condition still existed, Bitcoin floundered around the $47,000 mark while XRP technical indicators flashed mixed signals.
Metaverse tokens like Decentraland and The Sandbox correlated as their price action jumped above the 50-SMA while flashing slightly bullish indications.
XRP

XRP managed to form two ascending triangles over the past 15 days and found its testing points between the $0.84 and $0.77 range.
After an ascending triangle breakout on 8 December, the bulls broke above the $0.88-level, but the price quickly dipped below the 50-SMA (blue).
Now, XRP saw a 7.91% five-day gain as it moved above the aforementioned level to flip it as immediate support. It becomes crucial to take note of the bullish divergence between the price action and the OBV trendline (white). OBV steadily marked higher lows while the price action kept testing the same $0.77 level for 15 days now.
However, the near-term technical indicators slightly favored the bears. At press time, XRP traded at $0.8255 after noting a 20.2% 30-day decline. Over the past ten days, the RSI struggled to cross the 55-mark. Also, the Volume oscillator marked lower lows, indicating a weak bullish move.
Decentraland (MANA)
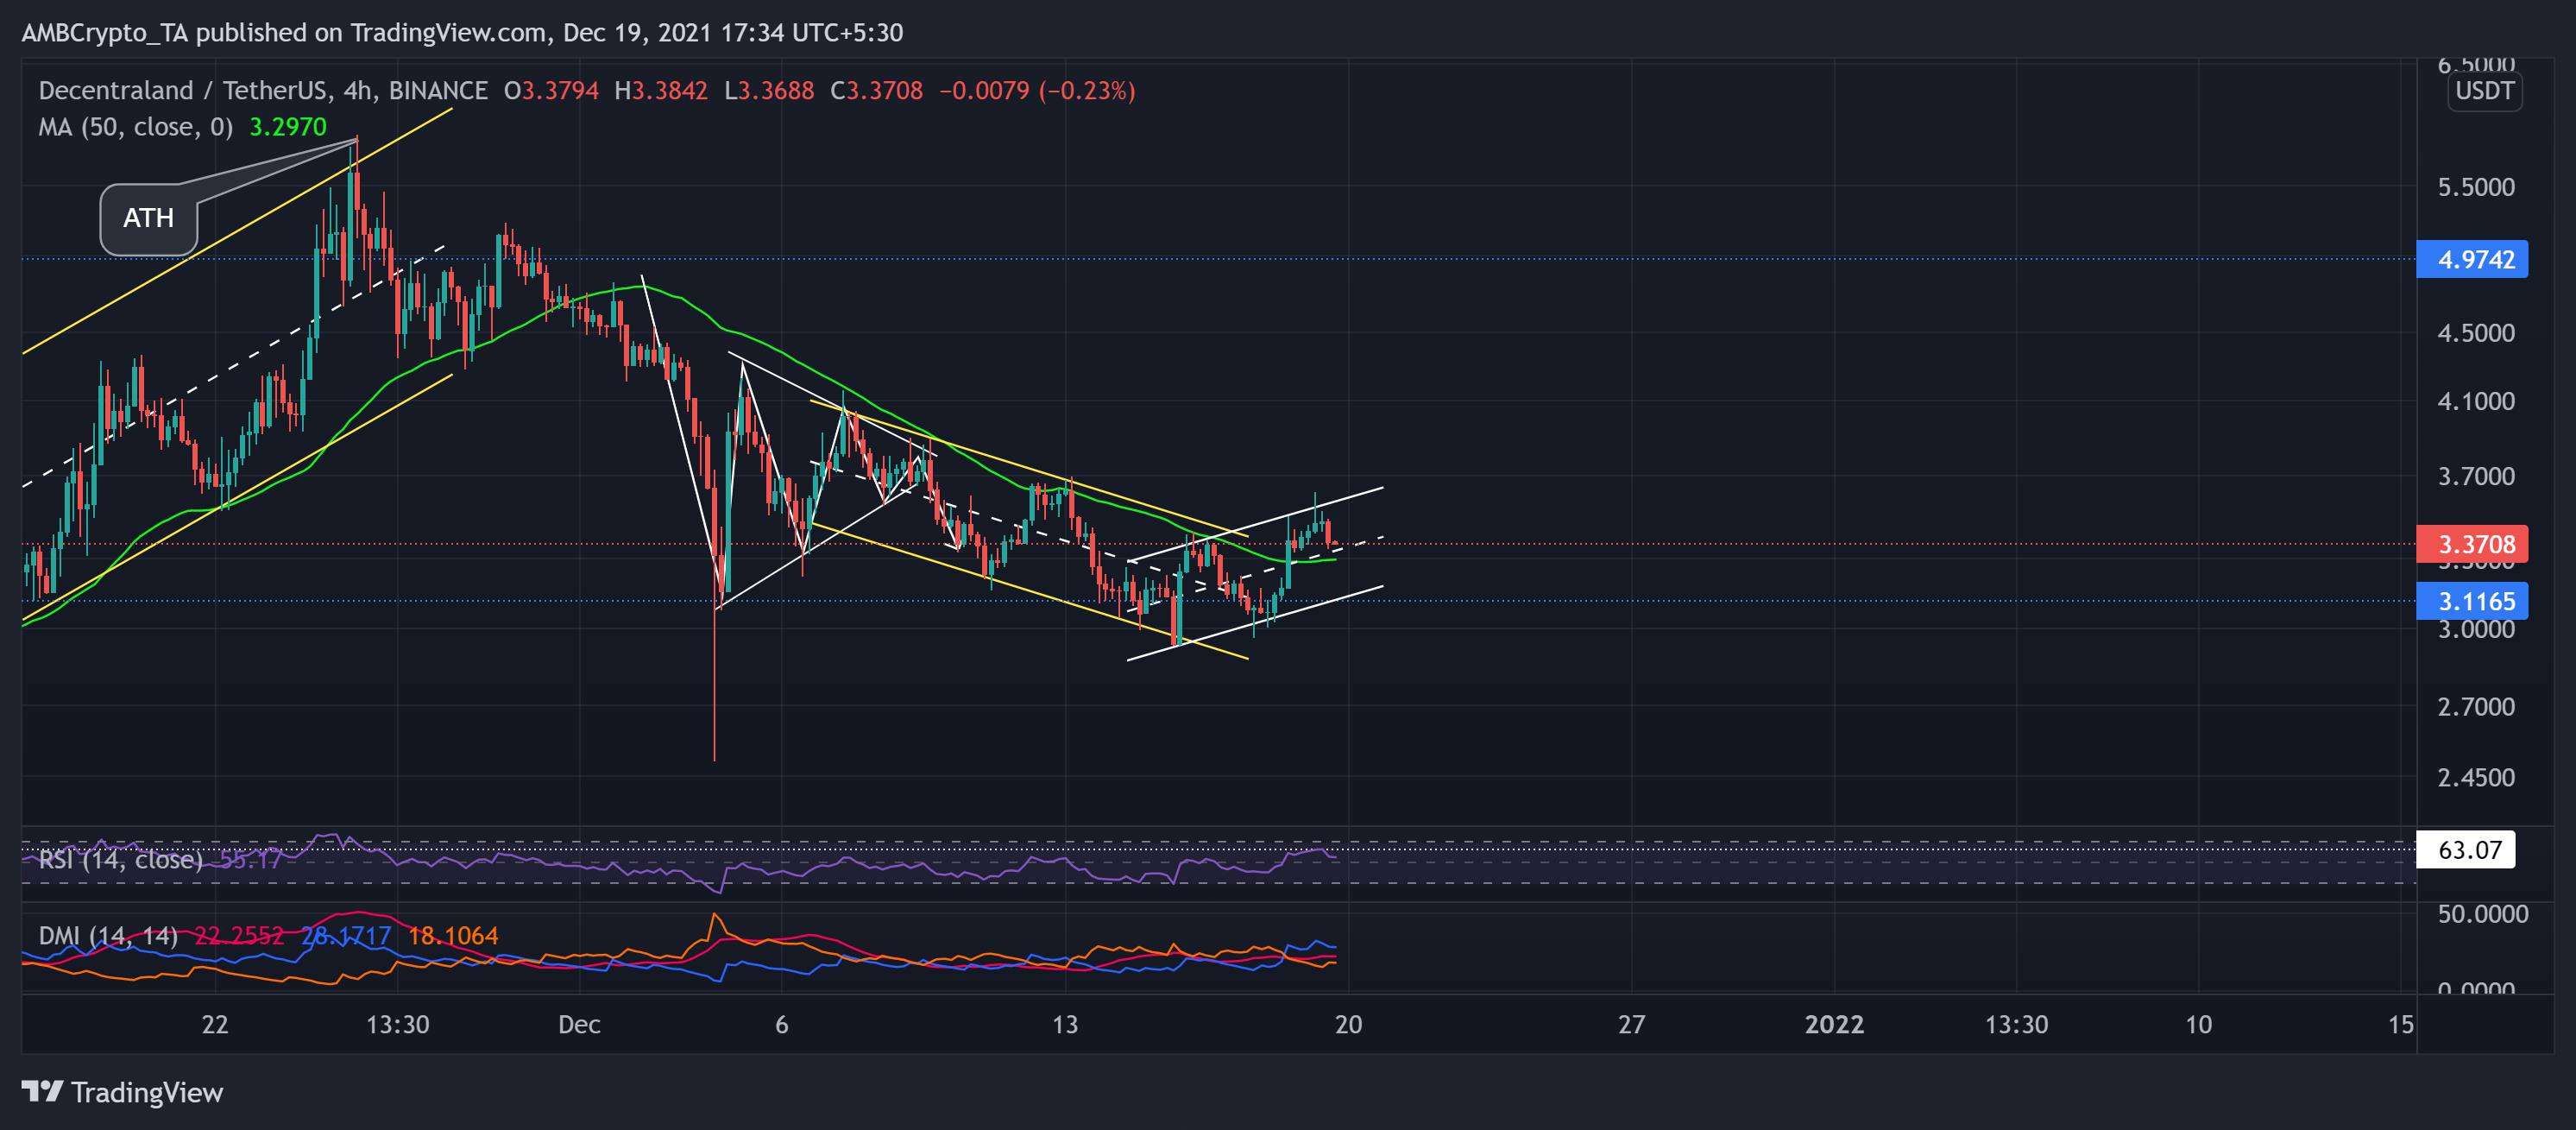
MANA saw a bearish pennant breakout on 9 December. This fall transposed into a down-channel after the alt noted a 25.83% decline from 7 to 15 December.
Despite the fall, the bulls ensured the one-month support at the $3.11-mark. As a result, MANA noted a 15.36% four-day push above the 50-SMA (green). The aforementioned level stood as resistance since the beginning of this month and now flipped into its immediate testing support.
At press time, MANA traded 42.2% below its ATH at $3.3708. The RSI touched the 63-mark for the first time since its ATH on 25 November. Further, the DMI depicted buying preference while the ADX displayed a slightly weak directional trend.
The Sandbox (SAND)
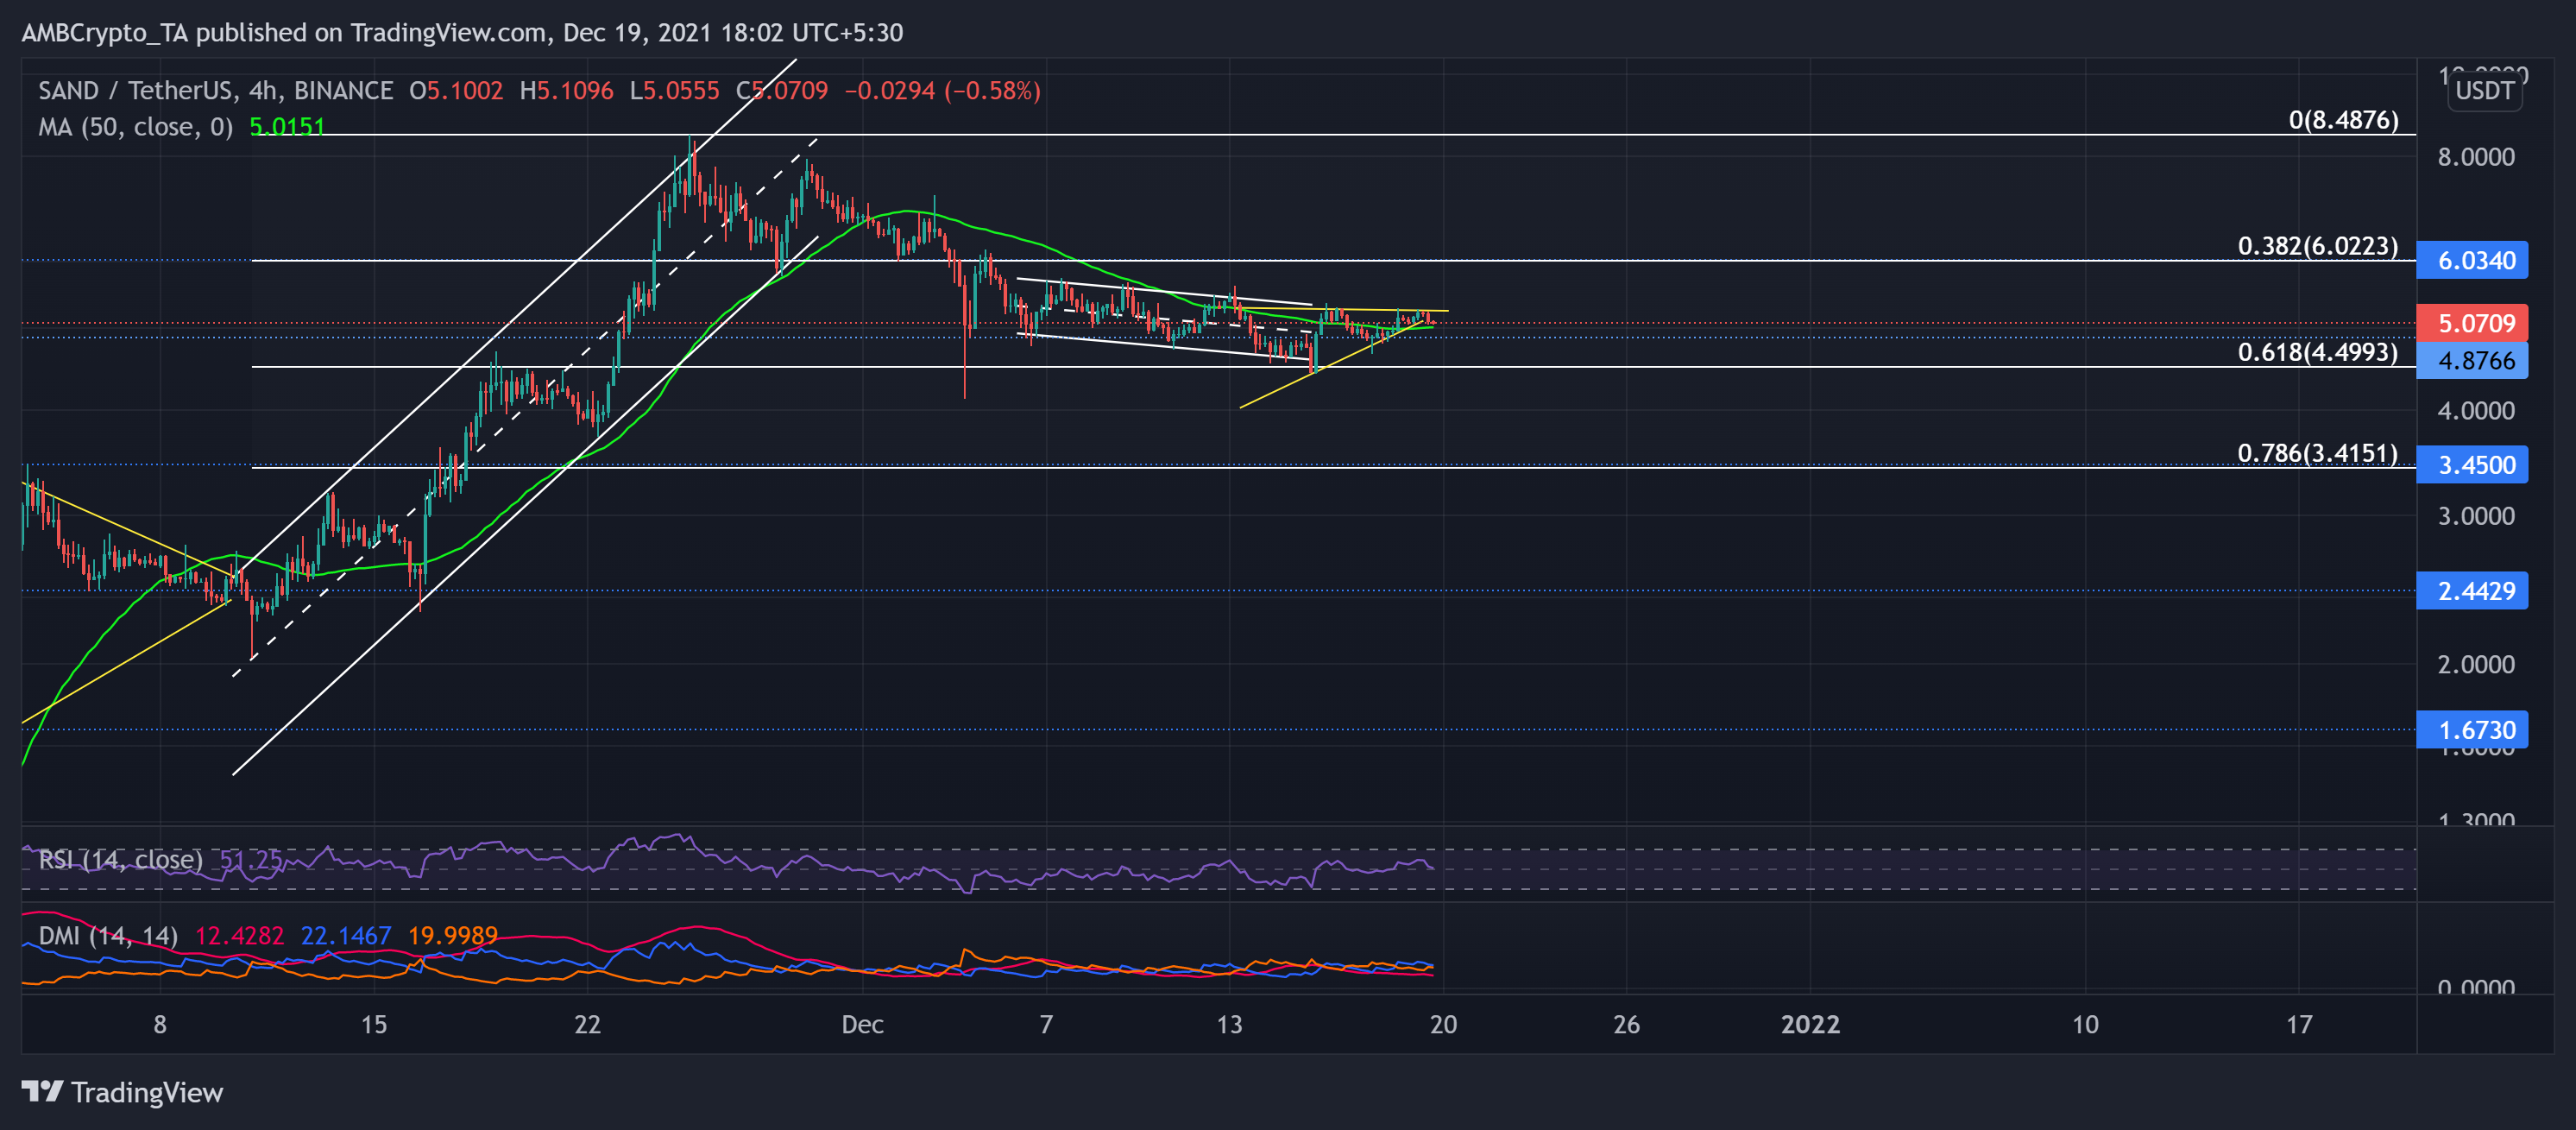
Since 13 December, SAND (like XRP) formed an ascending triangle on its 4-hour chart.
After striking its ATH on 25 November, the alt has steadily declined in a down-channel (white) and found support at the golden 61.8% Fibonacci level. Thus, similar to MANA, even SAND witnessed an over 15% four-day push above its 50-SMA (green) that stood as an immediate testing level.
At press time, the alt traded 38.6% below its ATH at $5.0709. The RSI seemed to weaken as it approached the half-line. Also, the DMI displayed a slight bullish bias. But the ADX depicted a weak directional trend.