


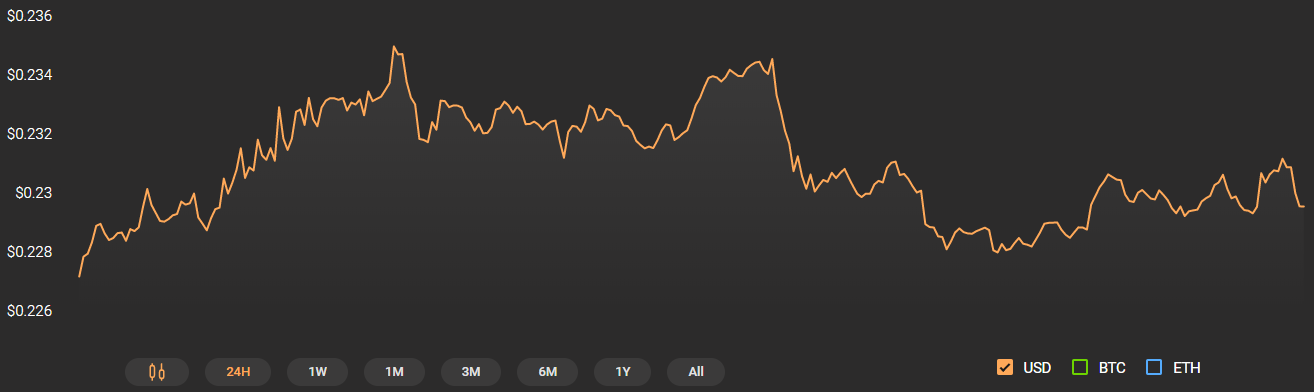
XRP went on a downtrend along with other top coins last weekend. The coin showed signs of recovery following the dip and surged by 1.48% against the US Dollar over the past 24-hours and was trading at $0.232, at press time. According to data from CoinMarketCap, the coin registered a market cap of $10.06 billion and a 24-hour trading volume of $1.48 billion, a significant 18% of which was contributed by OKEx Korea via the trading pair XRP/BTC.

XRP 12-Hour Chart:

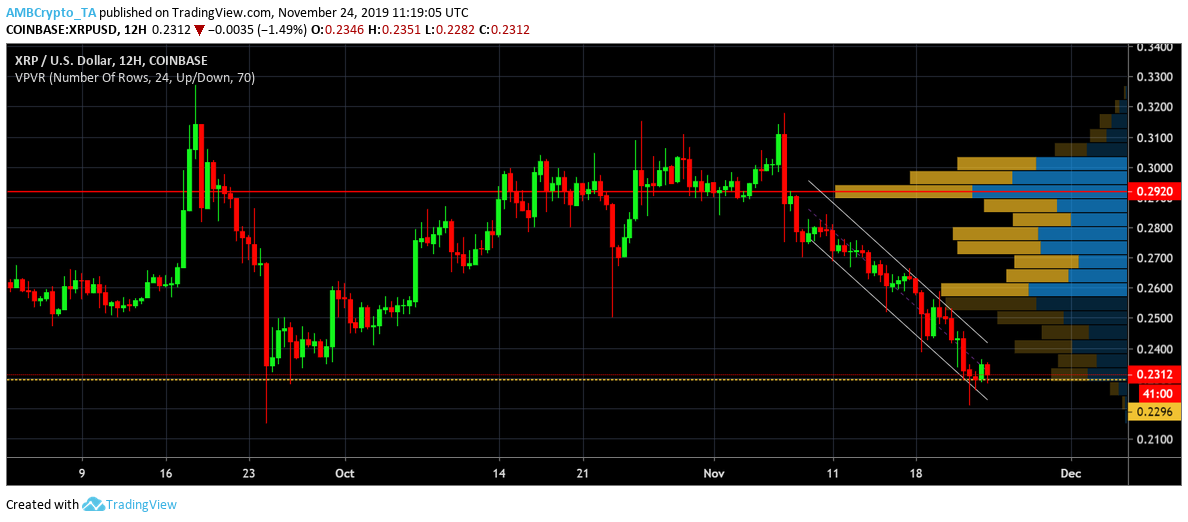
XRP’s 12-hour chart depicted the formation of a descending channel pattern with its price channeling down two downward sloping trendlines. This was indicative of a potential bullish breakout in the near term. Volume Profile [VPVR] indicator exhibited maximum trade volume in the range of $0.20-$0.30. If the trend persists and an upside breakout occurs, the coin’s price could move towards the high volume node and inch close to the psychological $0.30 barrier.
While a bearish reversal was unlikely, XRP was currently trading close to its support at $0.22.
Bearish signals
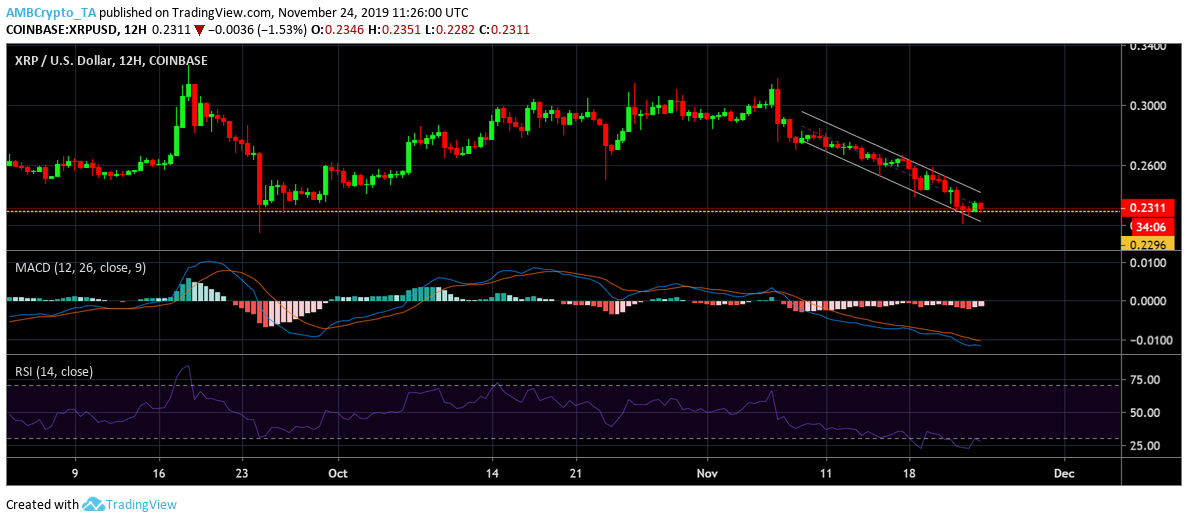
MACD line hovered below the signal line in the above XRP chart. This predicted bearish phase for the coin. Additionally, RSI was well below the 5o median line which depicted a negative market sentiment among the XRP investors due to high selling pressure.
Conclusion:
Despite the pattern suggesting a bullish phase for the coin in the near-term, the indicators projected a bearish picture for the coin. This could imply another potential decline in its price down the channel before the price of XRP finally breaks out to the positive side.