XRP, Polkadot, Near Price Analysis: 15 March

With Bitcoin struggling to find a close above the $40,000-mark, the near-term technicals of XRP, Polkadot, and NEAR demonstrated a bearish preference. Although NEAR showed improvement signs, a close below its 20 EMA could trigger a hidden bearish divergence on its 4-hour chart.
XRP
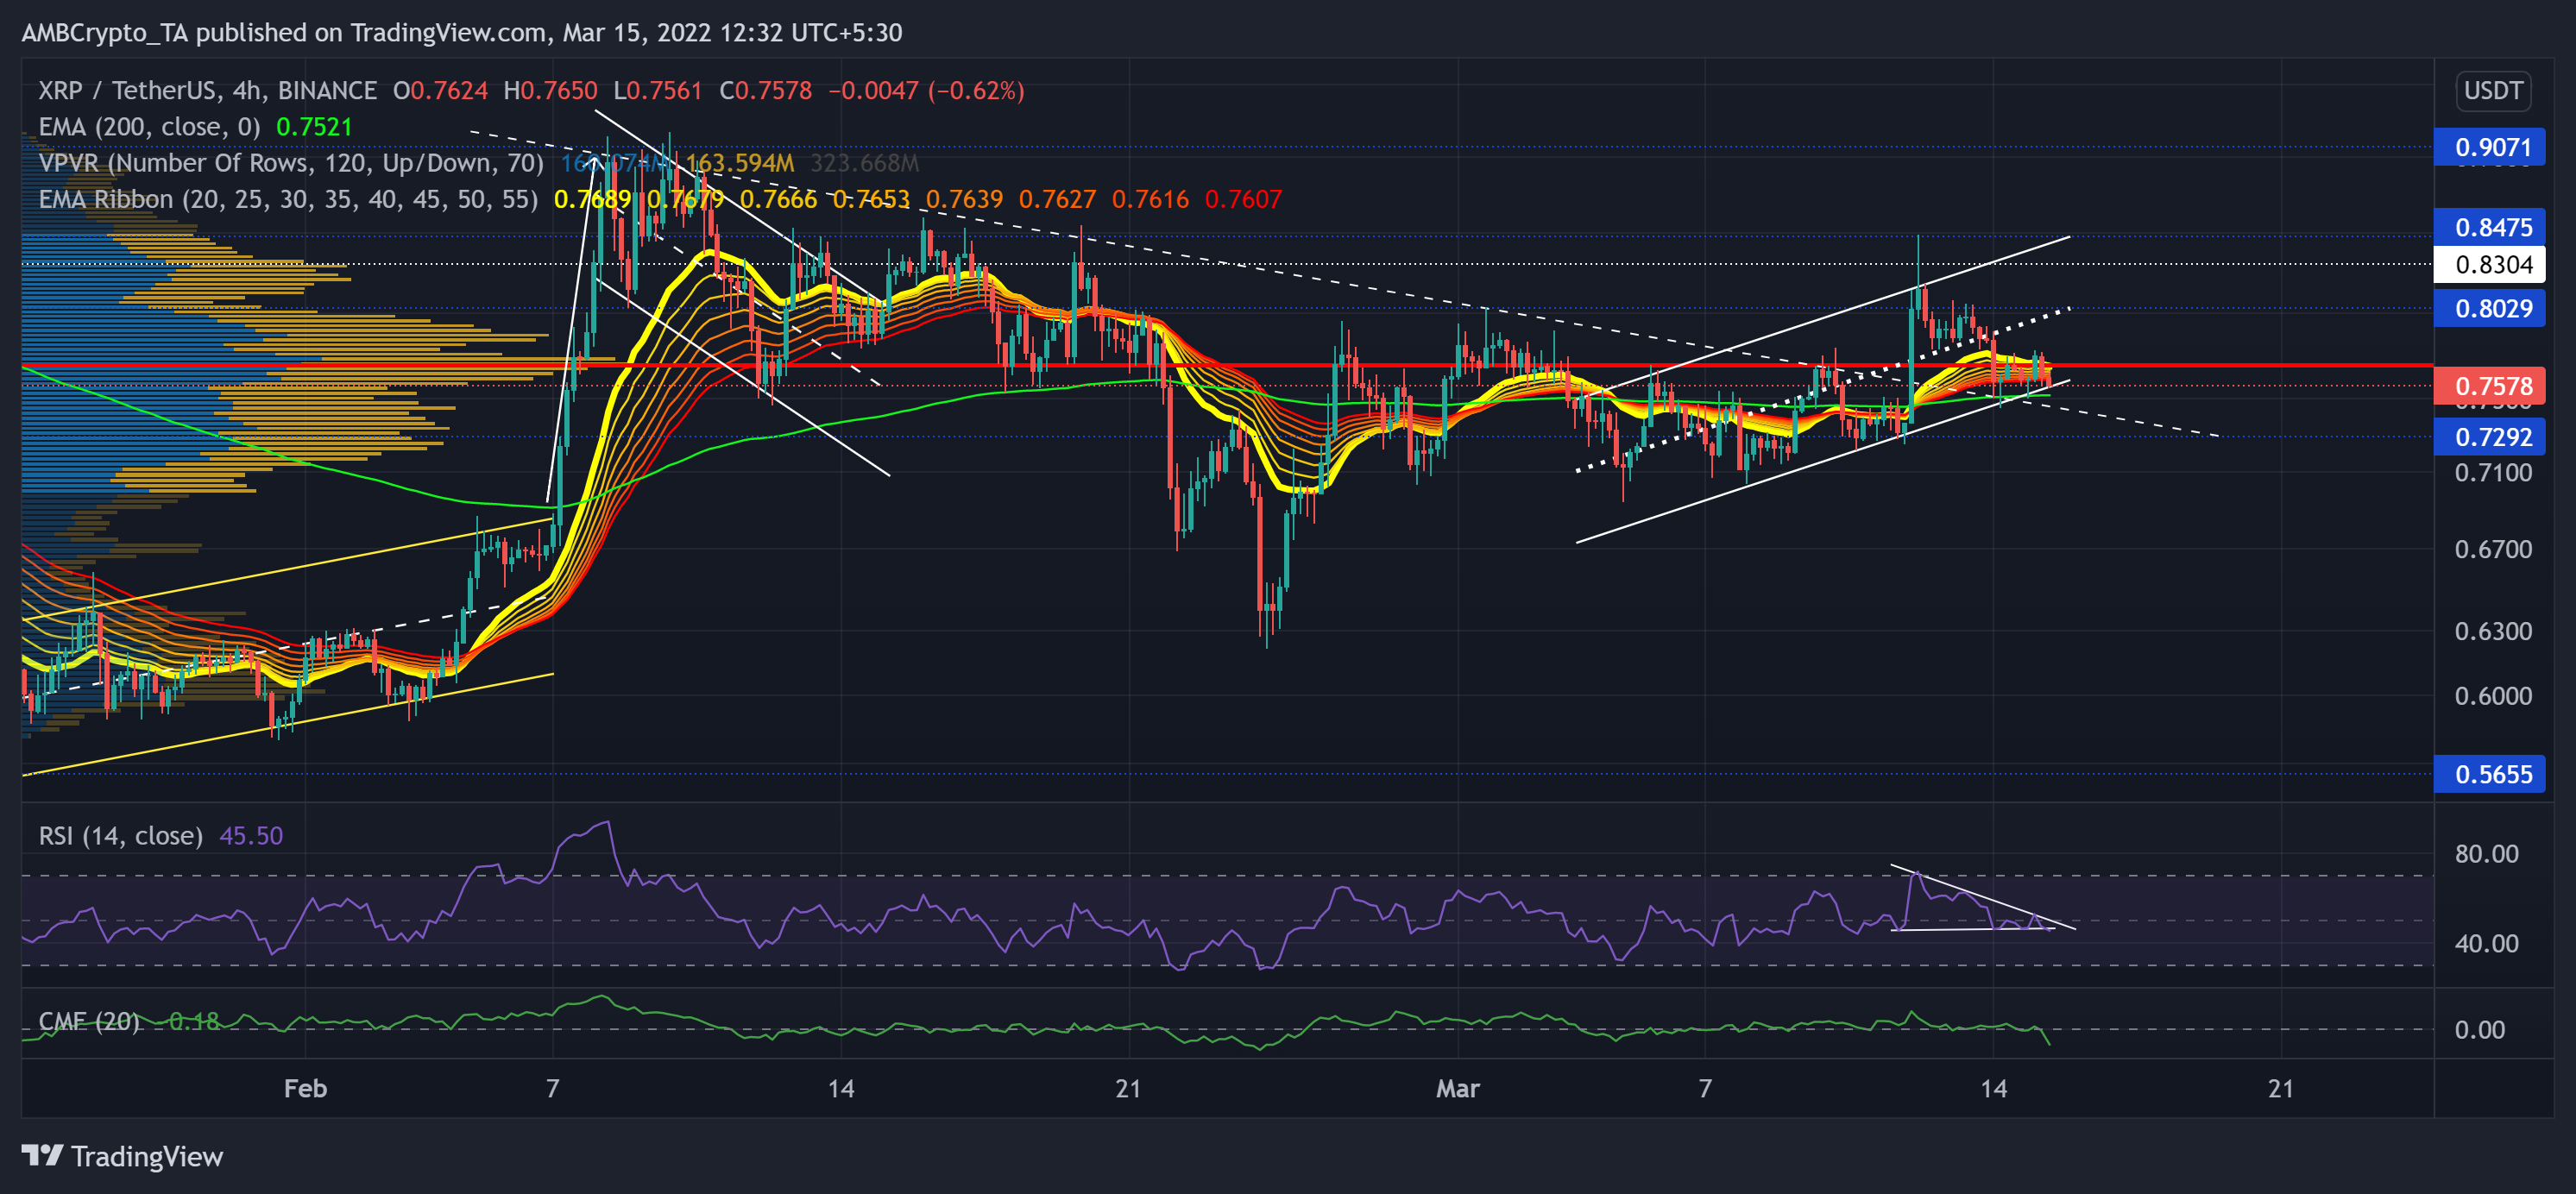
Since falling below its long-term Point of Control (red) at the $0.77-mark, XRP swiftly fell to touch its six-month low on 22 January. Post that, the bulls stepped in to defend the 10-month $0.56-support.
Consequently, with a 67.4% revival since, XRP flipped the EMA ribbons toward the bullish side. Since then, the alt gradually declined as it witnessed a trendline resistance (now support) (white, dashed) on its 4-hour chart.
Over the last few days, XRP saw an up-channel (white) that helped the alt find a close above its 200 EMA (green). Now, the immediate resistance stood near the POC while the trendline support offered strong support.
At press time, XRP traded at $0.7578. After testing the midline multiple times over the last day, the RSI stood weak at the 46-mark. It marked a descending triangle and revealed a bearish edge. Furthermore, the southbound CMF took a steep plunge over the past day while reaffirming the increased bearish influence.
Polkadot (DOT)
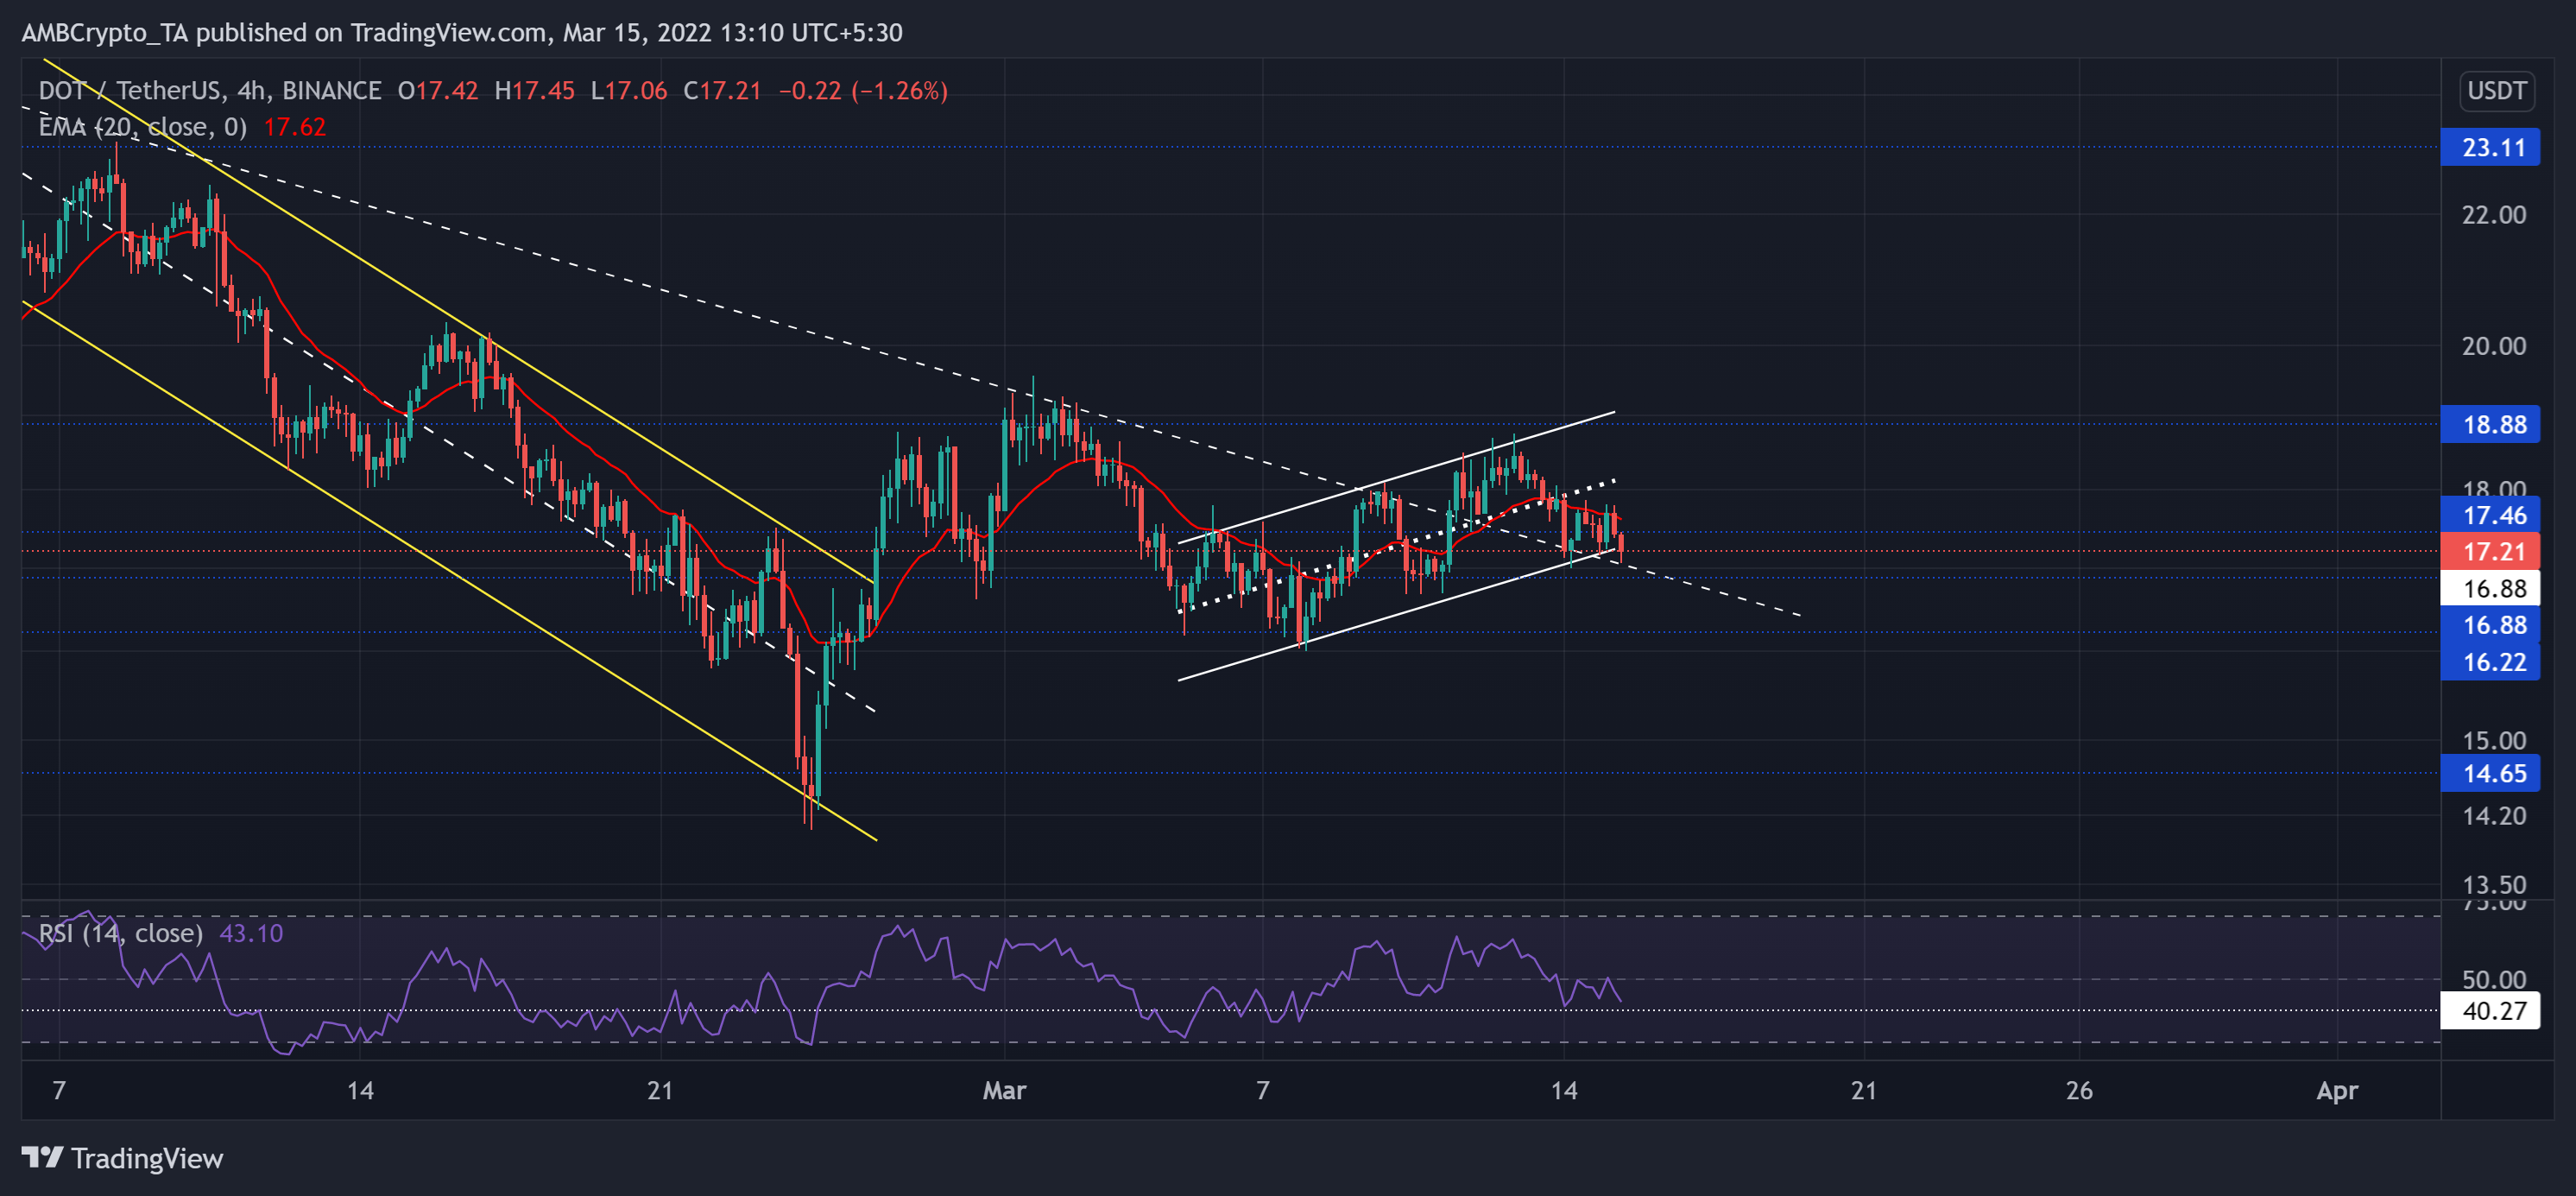
Since its ATH last year, DOT bears have refrained the bulls from taking on the driver’s seat. The alt was down by over 74% (from 4 November) as it plunged towards its seven-month low on 24 February.
The recent bullish rally marked an up-channel while the alt strived to cross the 20 EMA (red). Over the last few days, the alt snapped its four-month trendline resistance and flipped it to support. With the bears still refraining from giving up their edge, further retracements should find a base near the $16-zone.
At press time, the DOT traded at $17.21. The RSI struggled to keep itself above the equilibrium. Thus, it aimed to retest the 40-mark support and displayed a bearish bias.
Near Protocol (NEAR)

Since its ATH, NEAR lost more than half of its value and plunged toward its 11-week low on 24 February. Moreover, it lost its crucial $10.9-level resistance.
After a steep patterned breakdown, NEAR adhered to its trendline support while diving towards the $7.6-mark. Then, after witnessing an inverse head and shoulder on its 4-hour chart, NEAR kept testing the $9.5- support. Now, the 20 EMA (red) with the upper trendline of the down-channel (white) assumed strong resistance.
At press time, the NEAR traded at $10.054. The RSI saw decent growth over the last day. Now, a close below the midline would confirm a hidden bearish divergence with the price. Furthermore, the Supertrend now supported the selling tendencies in the near term.


