XRP Price Analysis: 2 May

After the drop during the 3rd week of April, XRP has rallied by 48% over the last week of the month, currently consolidating above the $1.50 mark. The recovery has been immediate and bullish momentum was still intact during the decline. At press time, XRP had a market cap of $72.5 billion, ranking 4th on the charts.
XRP 4-hour chart

XRP/USDT on Trading View
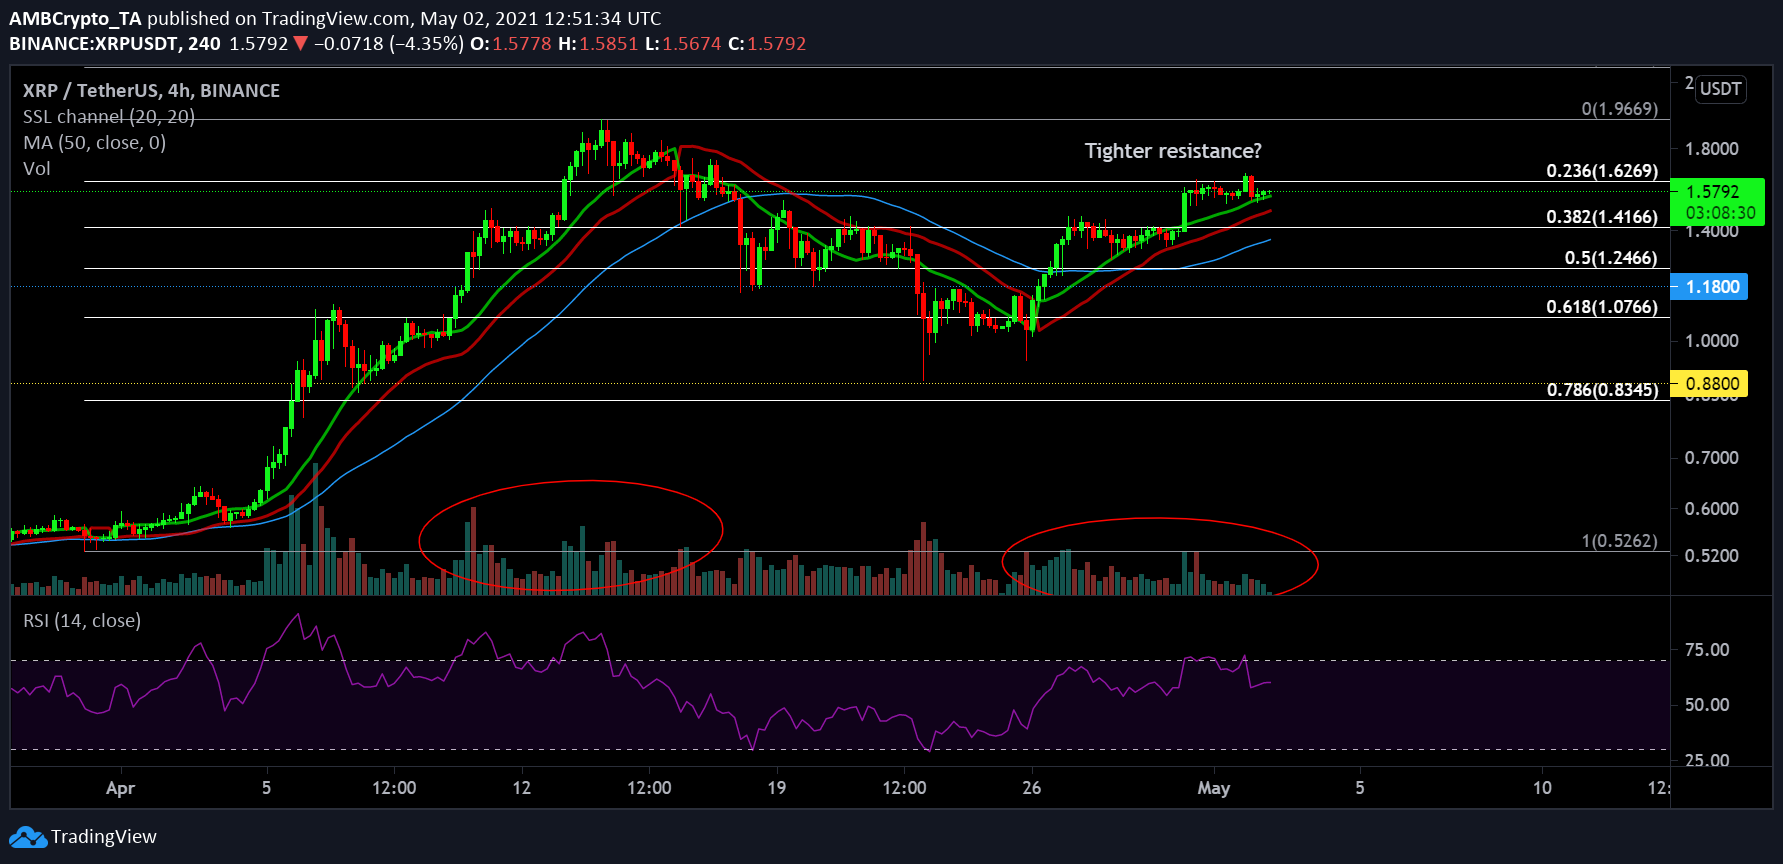
While gauging the 4-hour chart of XRP, bullish traits are undeniable but a possibility of dying momentum was also evident. Over the past week, XRP first consolidated near the $1.07 range, rising up to $1.41 and currently maintaining a position right under the $1.62 or 0.236 Fibonacci line. While SSL indicator continued to indicate a buy signal and the 50-Moving Average remained a strong support, the volume was vastly reduced in comparison to early April, when the price was at the same price point.
Resistance at $1.62 could be tighter during the present rally and a re-test at an immediate support of 0.382 Fibonacci could occur going forward. A bullish breakout would allow a direct re-test at the previous high of $1.96.
Market Rationals

XRP/USDT on Trading View
Relative Strenght Index or RSI was under the overbought zone and buying pressure was witnessing more resistance than early April. MACD has currently registered a bearish crossover with the signal line moving over the bullish line. Awesome Oscillator or AO also suggested increasing bearish momentum, and the price consolidates.
On-balance volume has maintained a higher position but traders may sell at this point, considering existing profits.
Conclusion
A break above $1.62 would have allowed higher chances of a re-test at $1.92. XRP’s present scenario was more balanced than bullish.


