XRP Price Analysis: 21 March

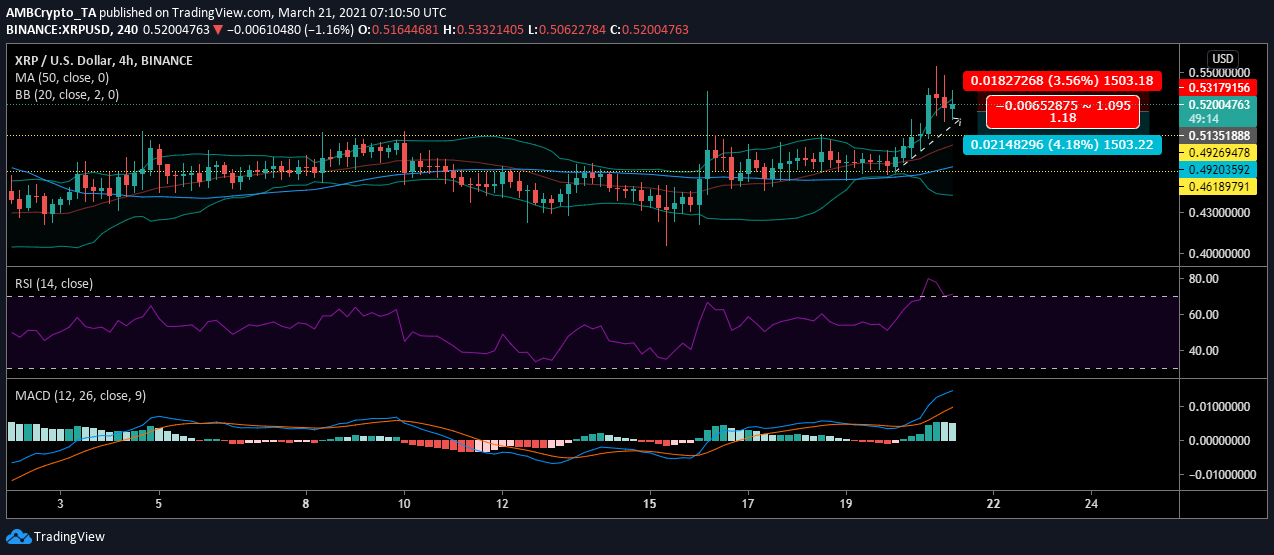
The XRP market had been consolidating between the $0.4296 and $0.4618 price range for a while, before shooting higher on the price scale. With a market capitalization of $23.71 billion, the seventh-largest digital asset was being traded at $0.5188 after a minor retracement.
XRP 4-hour chart

Source: XRPUSD on TradingView
The chart above noted the sideways movement of XRP between the aforementioned price level. This consolidation helped in maintaining a level of bullishness in the XRP market. With a surge witnessed overnight, the XRP market has become quite bullish, but a fall may soon see a correction set in the market.
This fall could be beneficial for users invested in XRP and looking to short the digital asset.
Reasoning
Given the price surge witnessed in the market, the volatility has also surged. This high volatility was matched with a bullish market as indicated by the signal line which remained under the candlesticks. Whereas the 50 moving average has also remained under the price bars, noting an upwards trending price.
Although XRP’s surge came after an extended sideways movement, the relative strength index remained close to the overbought zone. With the surging prices, the RSI briefly entered the overbought zone but was now dropping. The RSI value remained at 69, which was very close to the overbought zone, however, as the sellers enter the market, the price may continue to falter.
The MACD indicator was highlighting the bullishness in the market as it remained above the signal line. However, the growing gap between the two was a sign of a trend reversal making its way to the XRP market.
Crucial levels
Entry-level: $0.5135
Take Profit: $0.4920
Stop level: $0.5317
Risk to Reward: 1.18
Conclusion
The current XRP market saw a 20% surge in price within the past 20 hours, carrying its price to $0.555. However, the market was unable to hold on to this price level. As the selling pressure rises, the price may drop to $0.4920, and short positions could make a profit.


