Analysis
XRP Price Analysis: Coin continues to show sideways movement as bear growls
XRP, second-largest altcoin by market cap, was valued at $0.239 with its price dropping by 1.87% over the 24-hour cycle. With a market cap of $11.046 billion, XRP recorded $10.337 billion trade volume for the past 24 hours at press time. The dominant part of the trade volume was reported on MXC trade exchange for XRP/USDT pair, as per CoinMarketCap.

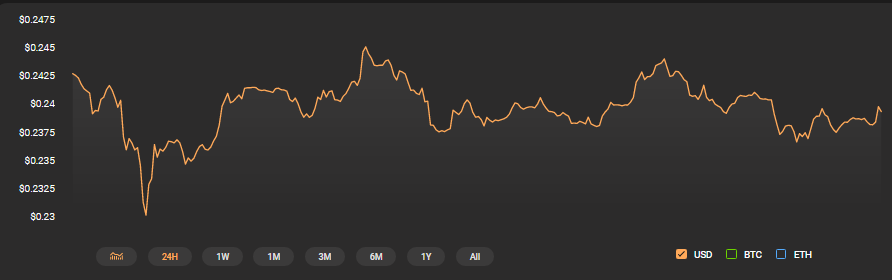
Source: CoinStats
1-Hour price chart
In 1-hour chart, XRP faced resistance at $0.319 in addition to getting support at $0.233. The coin saw its first downtrend from $0.317 to $0.279. The second downtrend started from $0.283 and ended at $0.241.

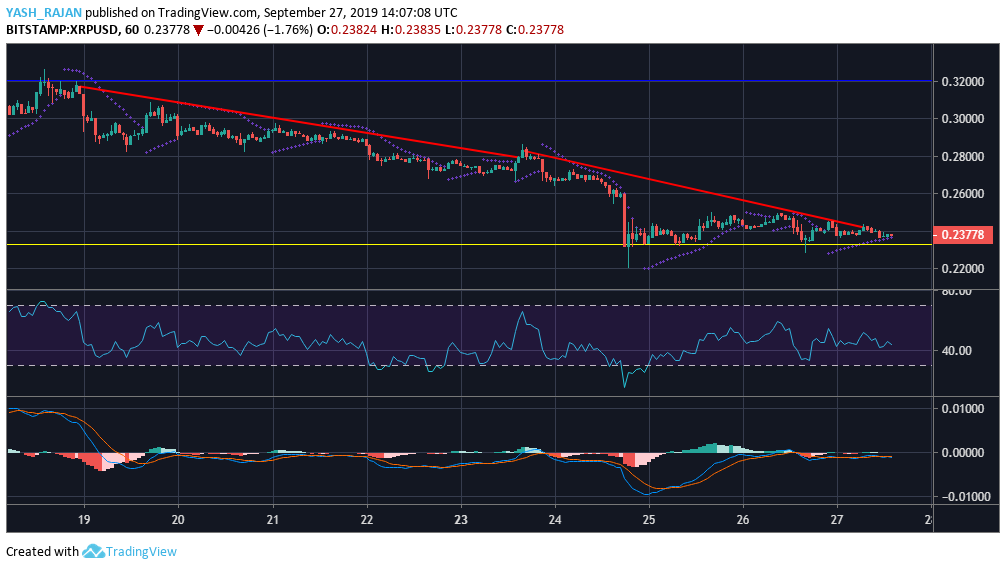
Source: TradingView
Parabolic SAR conveyed a bullish trend as the dotted markers were aligned below the candles.
RSI indicator stood at 44.09, indicating that selling pressure was high.
MACD line crossed above the signal line, revealing a bullish trend with a slight chance of reversal.
1-Day price chart
In one-day chart, XRP formed support at $0.230, with a resistance at $0.480. XRP recorded a sharp downtrend from $0.580 to $0.457. Further, the cryptocurrency recorded another downtrend from $0.473 to $0.314.

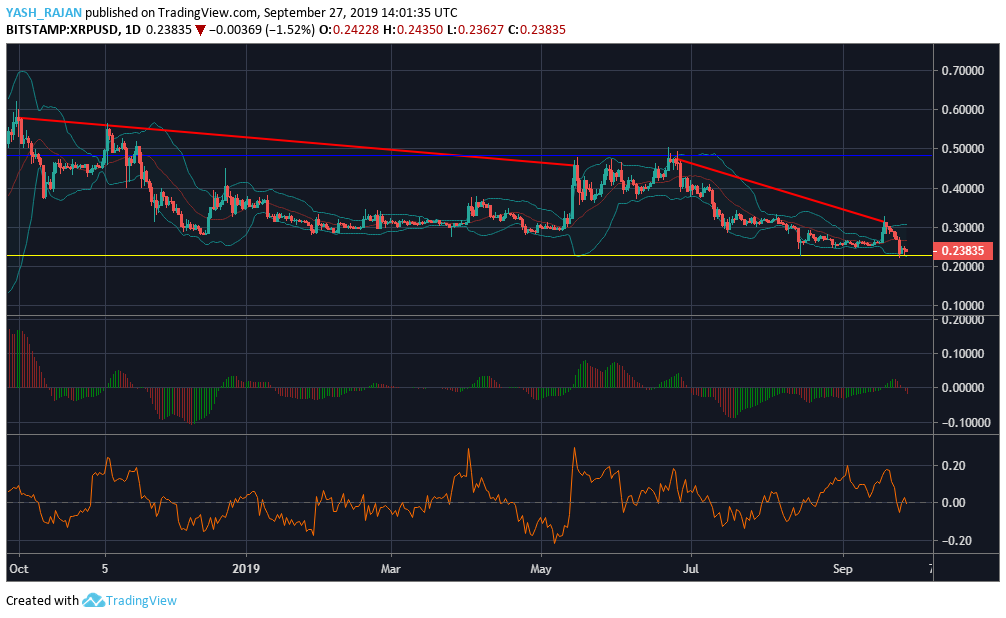
Source: TradingView
Bollinger Bands were expanding, displaying an increased volatility rate in the market.
Awesome Oscillator presented a bearish trend in the market as the long-term momentum was greater than the short-term momentum. The red lines appearing at the end indicating the possibility of a bearish market.
Chaikin Money Flow or CMF was exactly positioned at the zero-line after slight dipping. As it remained on the zero-line, it suggested that capital flowing into the market was equal to the capital flowing out of the market.
Conclusion
Indicators suggested that XRP stood in the bearish zone.