XRP price continue downs bearish path as bulls fail to take hold
XRP’s price recorded a market cap $11.3 billion at press time with a trading volume of $1.09 billion. The asset registered a growth of 2.16 percent at press time and XRP was valued at $0.26.
1-hour chart

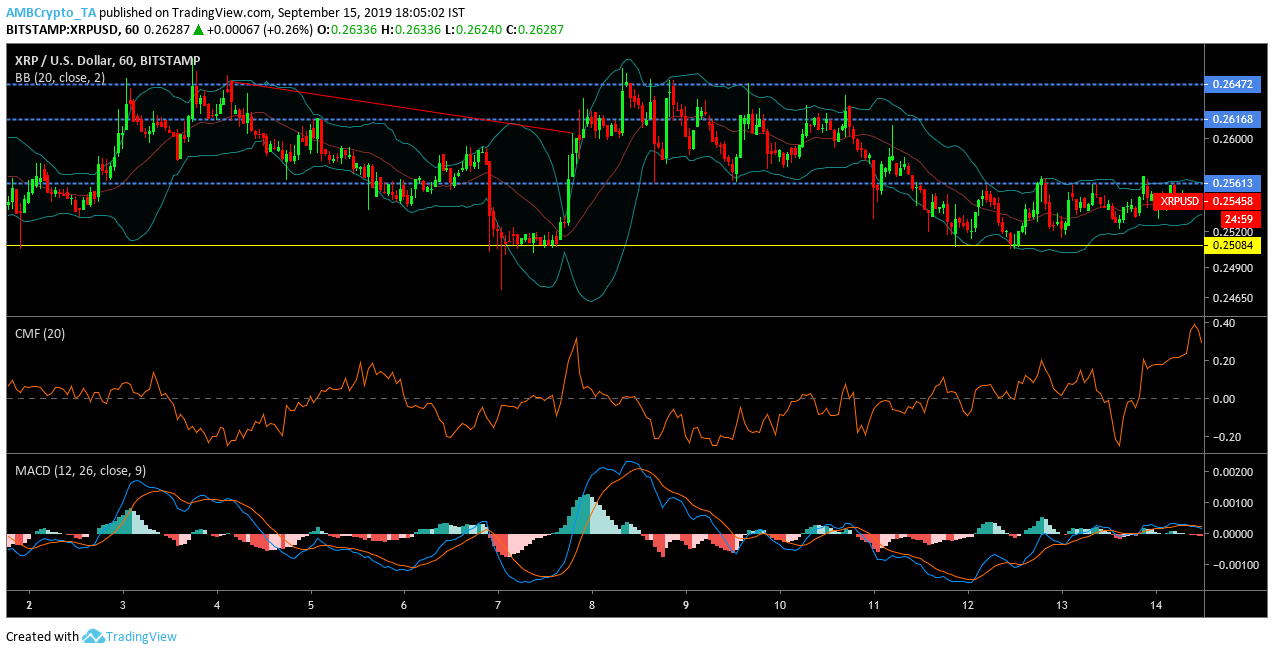
Source: Trading View
Resistance 1: $0.264
Resistance 2: $0.261
Resistance 3: $0.256
Support 1: $0.250
XRP’s price plummeted to it’s yearly low as mentioned earlier, and it was currently consolidating under Support 1. A major downtrend of $0.264 to $0.259.
The Bollinger Bands appeared to diverge on the charts which suggested further volatility in the future.
The Chaikin Money Flow or CMF line indicated that the capital flowing in was more than capital flowing out.
The MACD line was below the signal line suggesting a bearish trend.
1-day chart
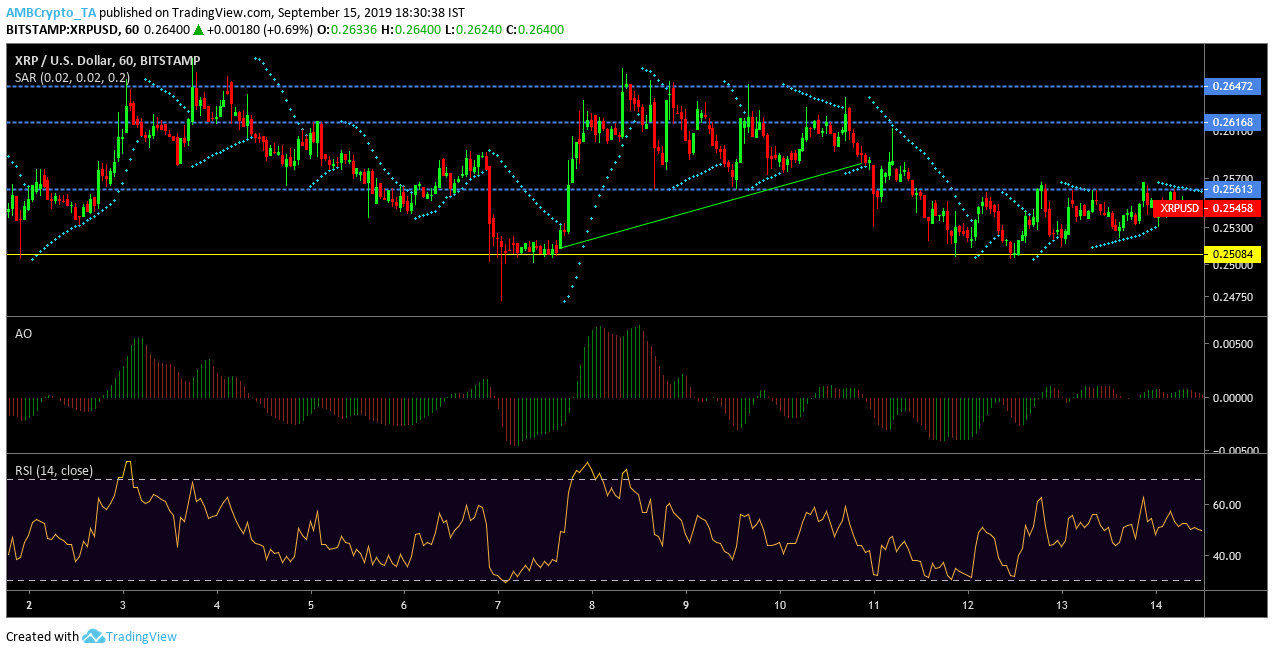
Source: Trading View
Resistance 1: $0.264
Resistance 2: $0.261
Resistance 3: $0.256
Support 1: $0.250
The long-term chart of XRP indicated that the breach of Support 1 is the lowest valuation for the token in 2019. A prominent uptrend which hiked the price from $0.251 to $0.262 is evident.
The Parabolic SAR was bearish as the dotted markers appeared above the candles.
The Awesome Oscillator or AO indicated a bearish momentum as the red bars took over in the chart.
The Relative Strength Index or RSI indicated that the token neutral.
Conclusion
The depletion of valuation to it’s yearly low are indicative signs that the bullish run might be over for good as the bears take charge of the market.