
- XRP has continued to trade below its 20-day exponential moving average.
- This suggests a decline in buying pressure.
Ripple [XRP] may extend its seven-day price decline as it closed below its 20-day exponential moving average (EMA) for the fourth consecutive day on 31st May.
When an asset trades below this key moving average, it is a bearish signal because it suggests that its current price has dropped below its average price of the past 20 days. Traders take this as an indication that the market trend is shifting towards sell-offs.
The demand for XRP loses steam
AMBCrypto’s assessment of some of XRP’s key technical indicators confirmed the possibility that the altcoin might shed some of its value in the coming days. For example, its key momentum indicators rested below their respective neutral spots at the time of writing.
XRP’s Relative Strength Index (RSI) was 46.64, while its Money Flow Index (MFI) was 40.96.
With these values, these indicators suggest a decline in demand for XRP as market participants preferred to distribute their current holdings rather than buy new tokens.
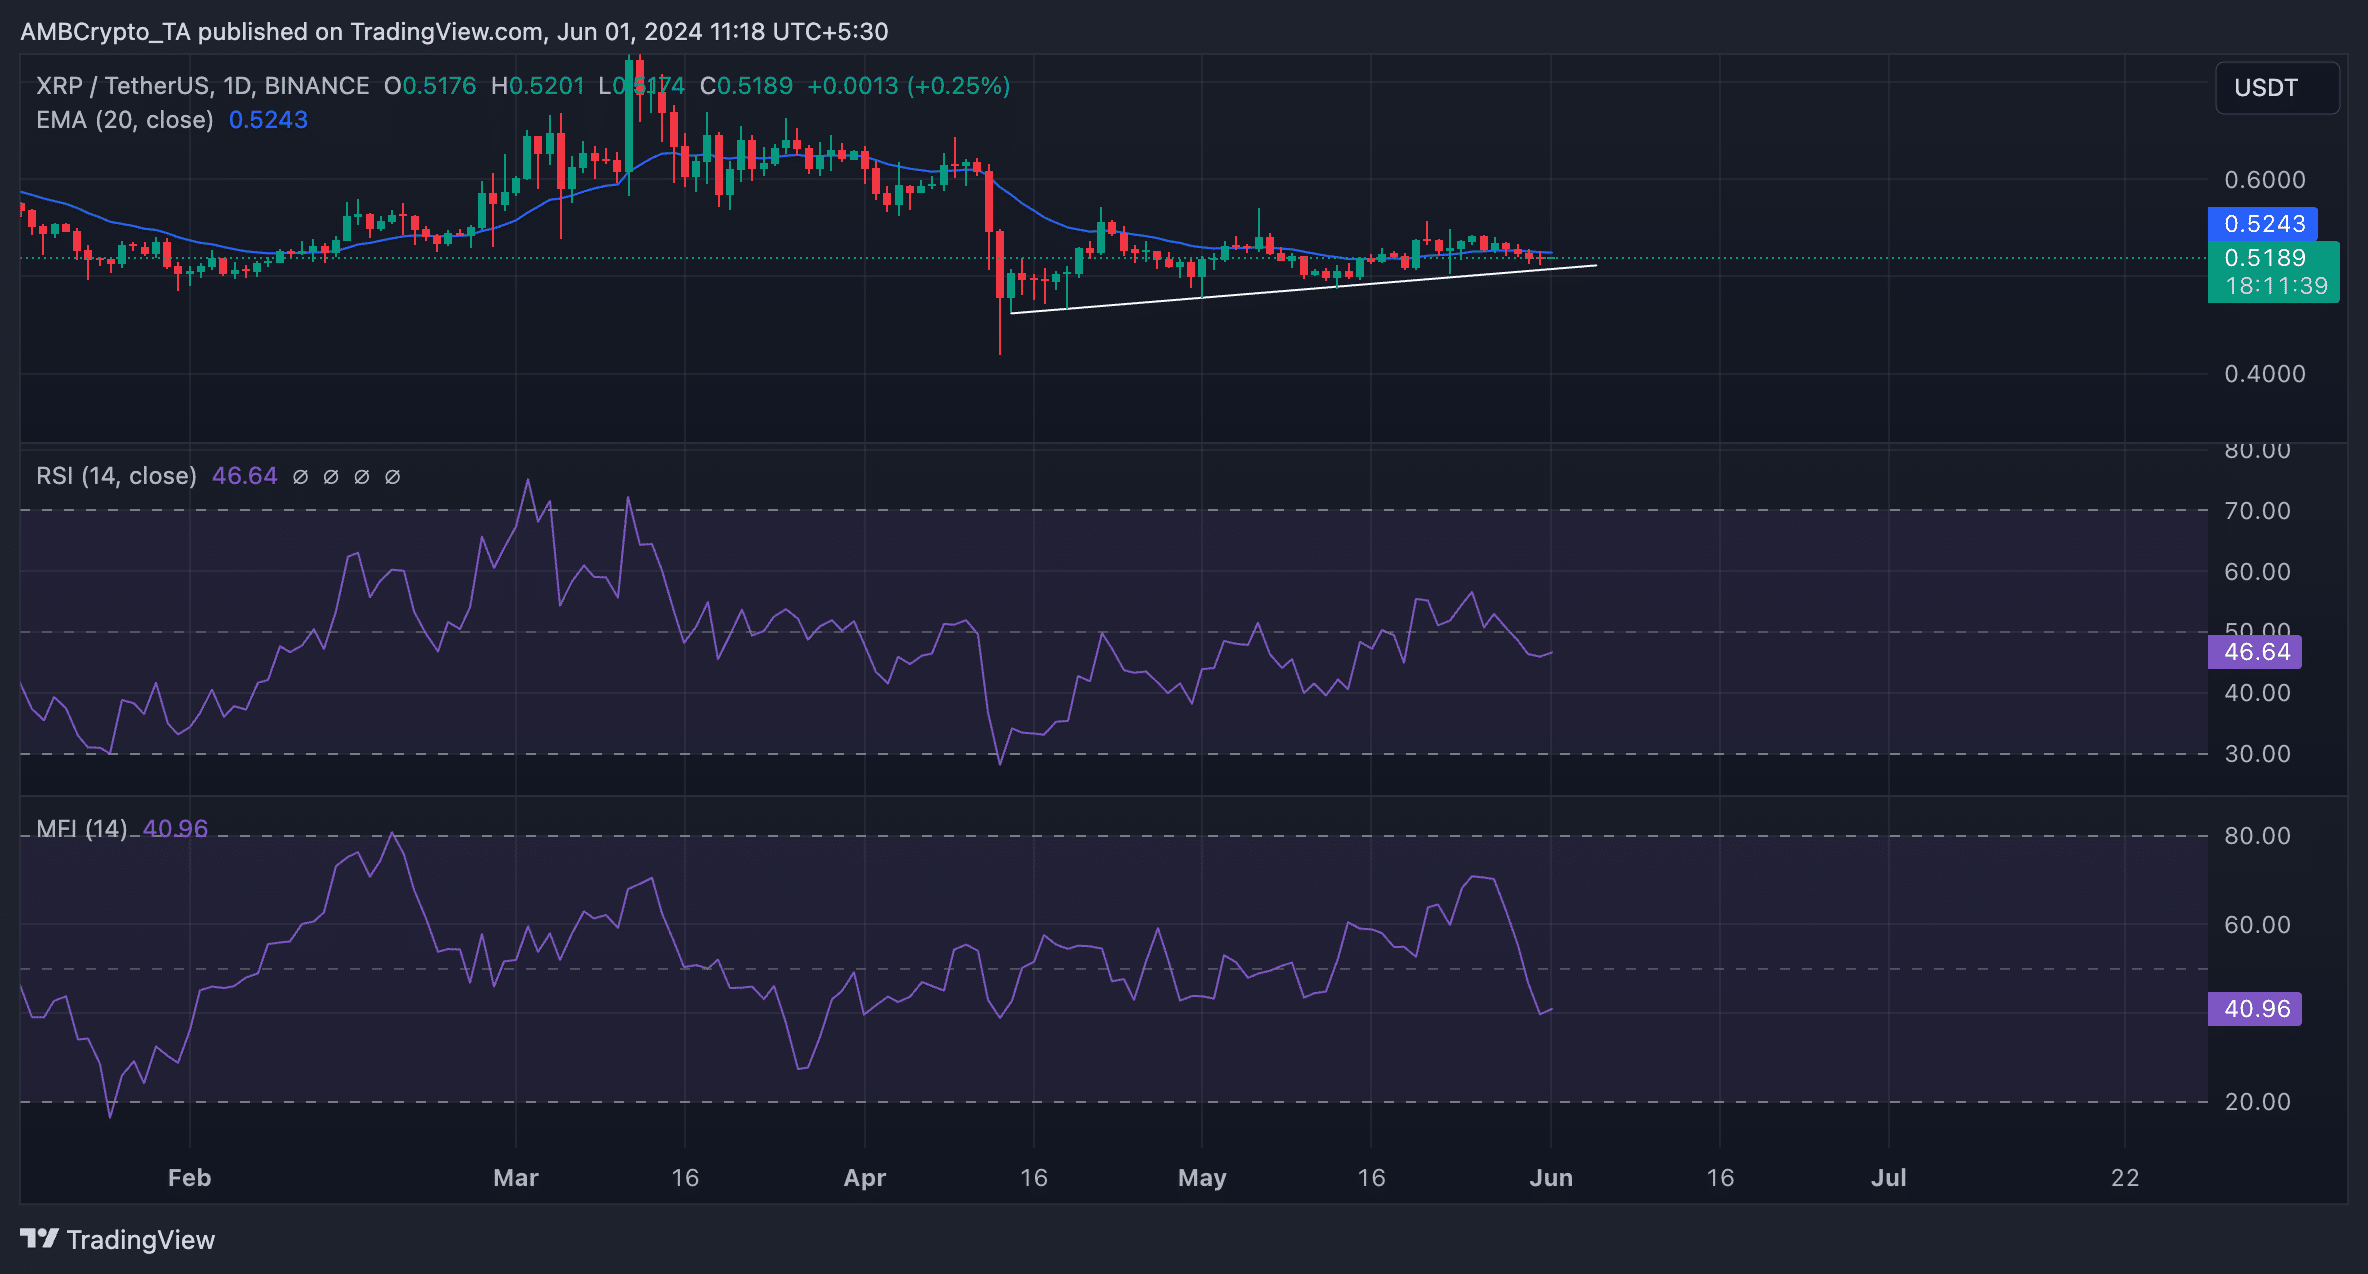
Source: XRP/USDT, TradingView
The uptick in XRP’s selling pressure was confirmed by its declining active addresses on-chain.
Per Santiment’s data, XRP’s daily active addresses observed using a 30-day moving average have cratered by 30% in the last month.
Similarly, the daily count of new addresses created to trade the altcoin during the same period has also plunged by 29%.
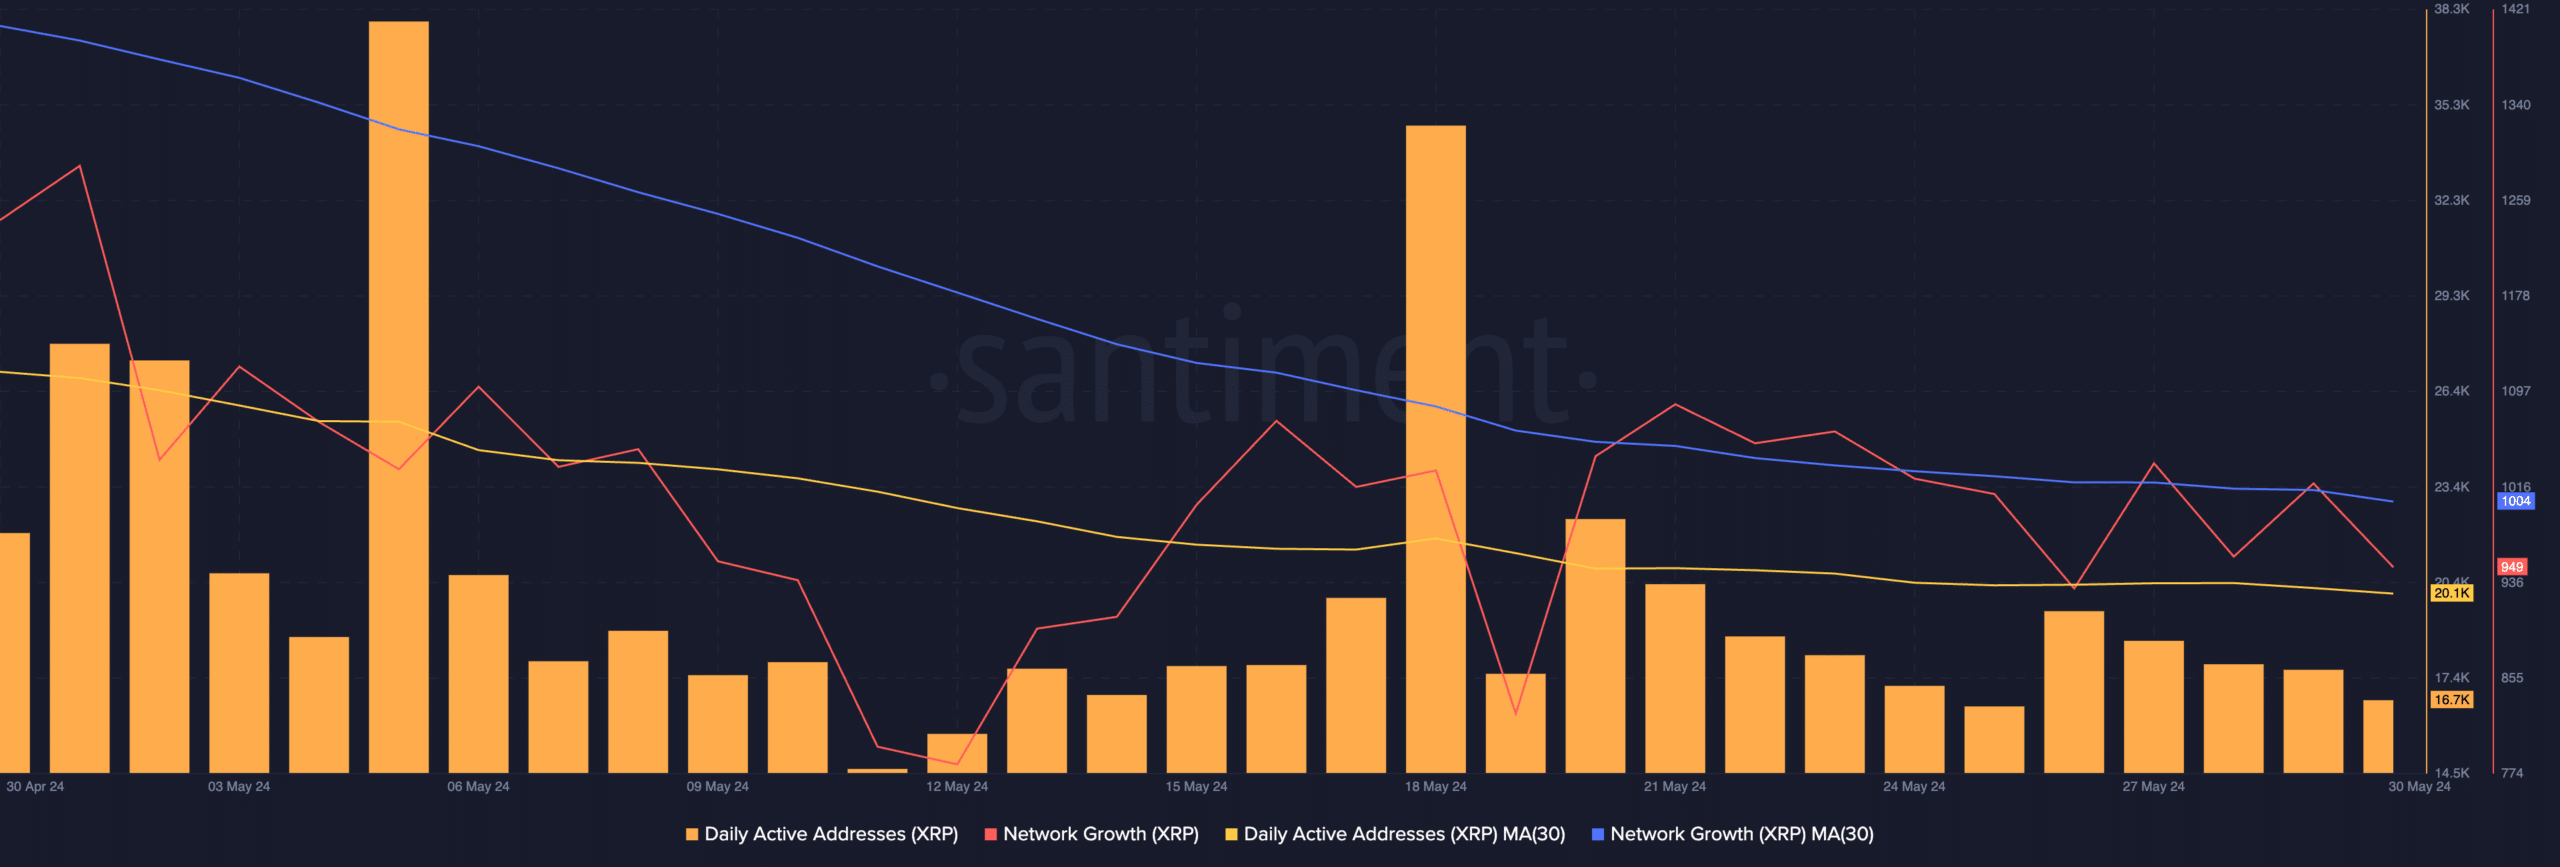
Source: Santiment
Notably, the decline in an asset’s active and new addresses often foreshadows a fall in its price.
Now might be the time
Interestingly, despite the decline in demand for the altcoin and its price, daily traders have continued to record profits.
An assessment of XRP’s daily ratio of transaction volume in profit to loss (using a 30-day moving average) returned a value of 1.16.
This suggested that during that period under review, for every transaction that ended in a loss, 1.16 transactions yielded profits for XRP traders.
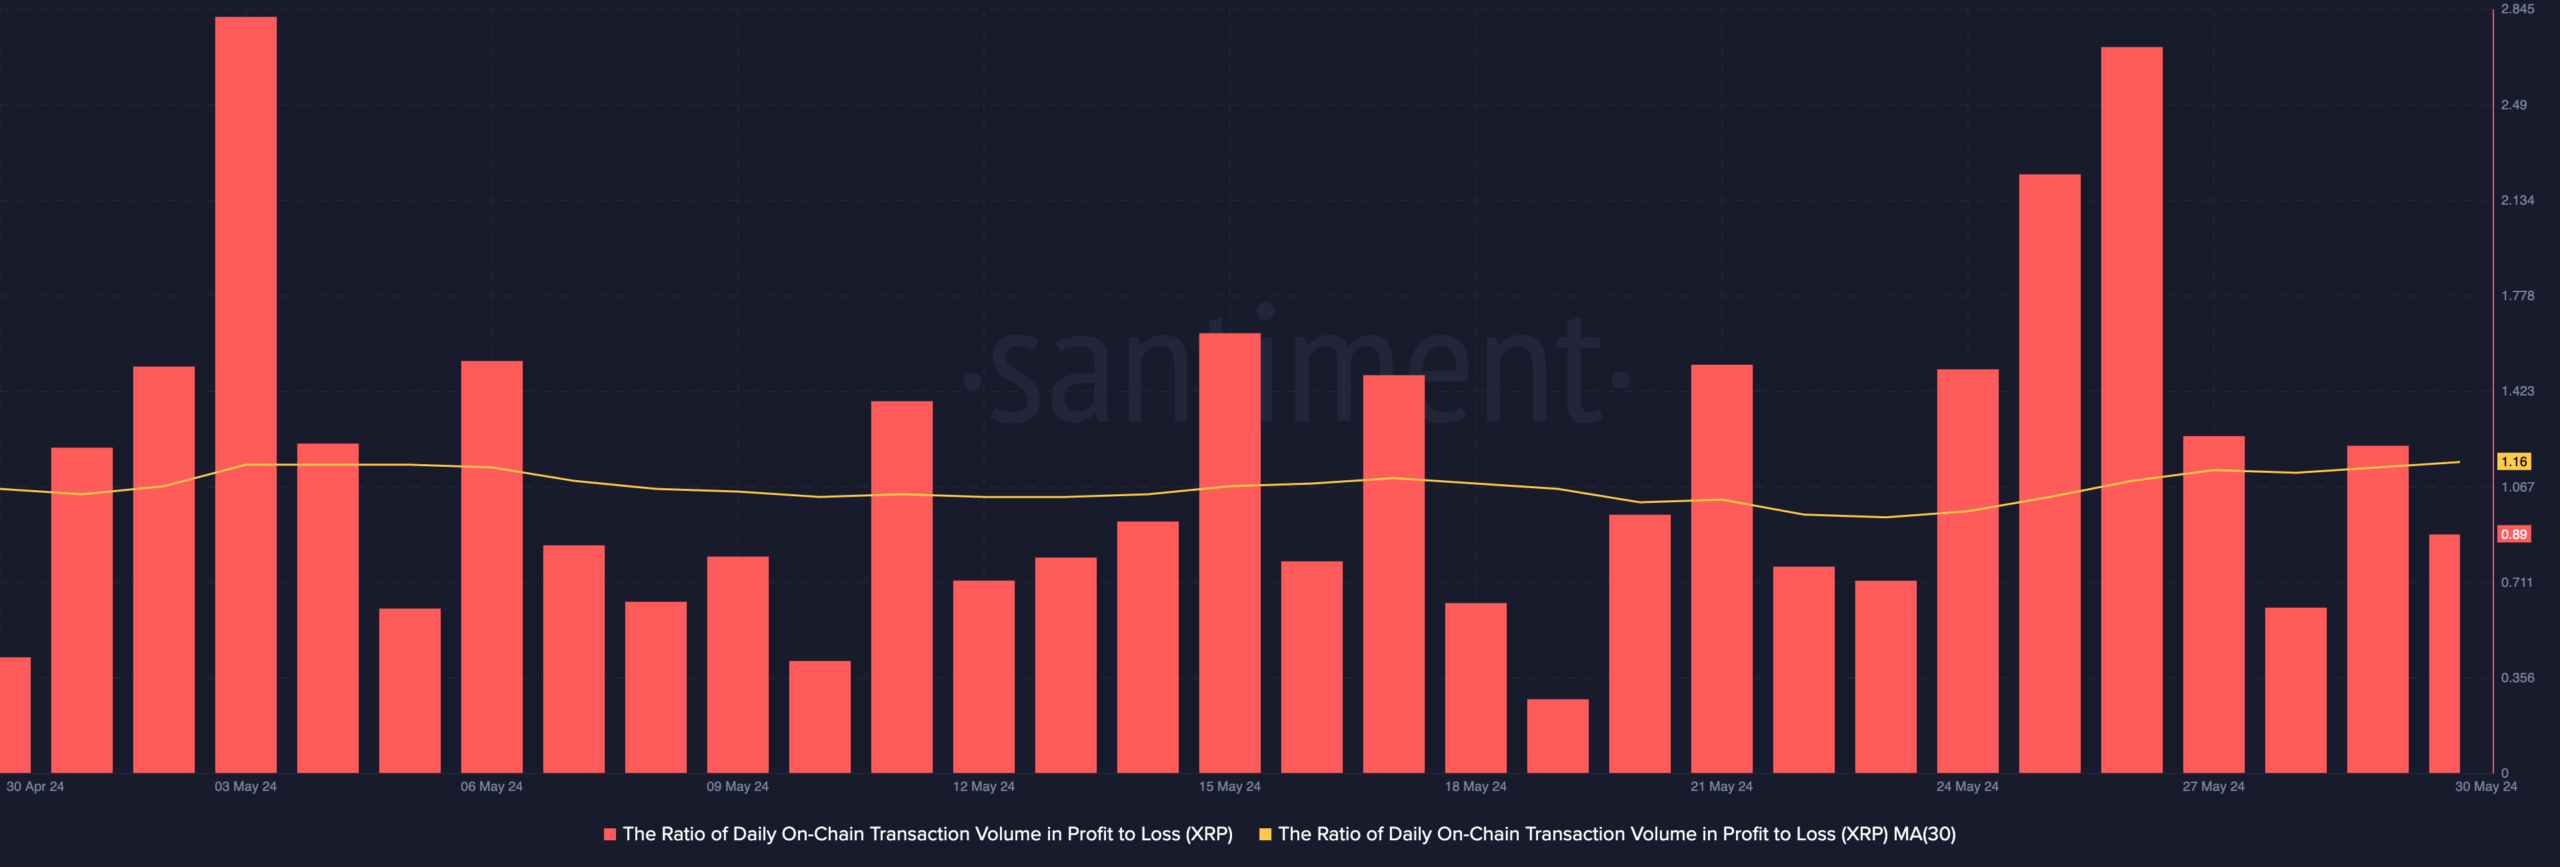
Source: Santiment
For traders looking to trade against the market, XRP’s negative Market Value to Realised Value (MVRV) ratio has flashed a buy signal.
Per Santiment’s data, XRP’s MVRV ratios on 30-day and 365-day moving averages were -0.7% and -8.5%, respectively, at the time of writing.
This metric tracks the ratio between an asset’s current market price and the average price at which each of its coins or tokens was acquired.
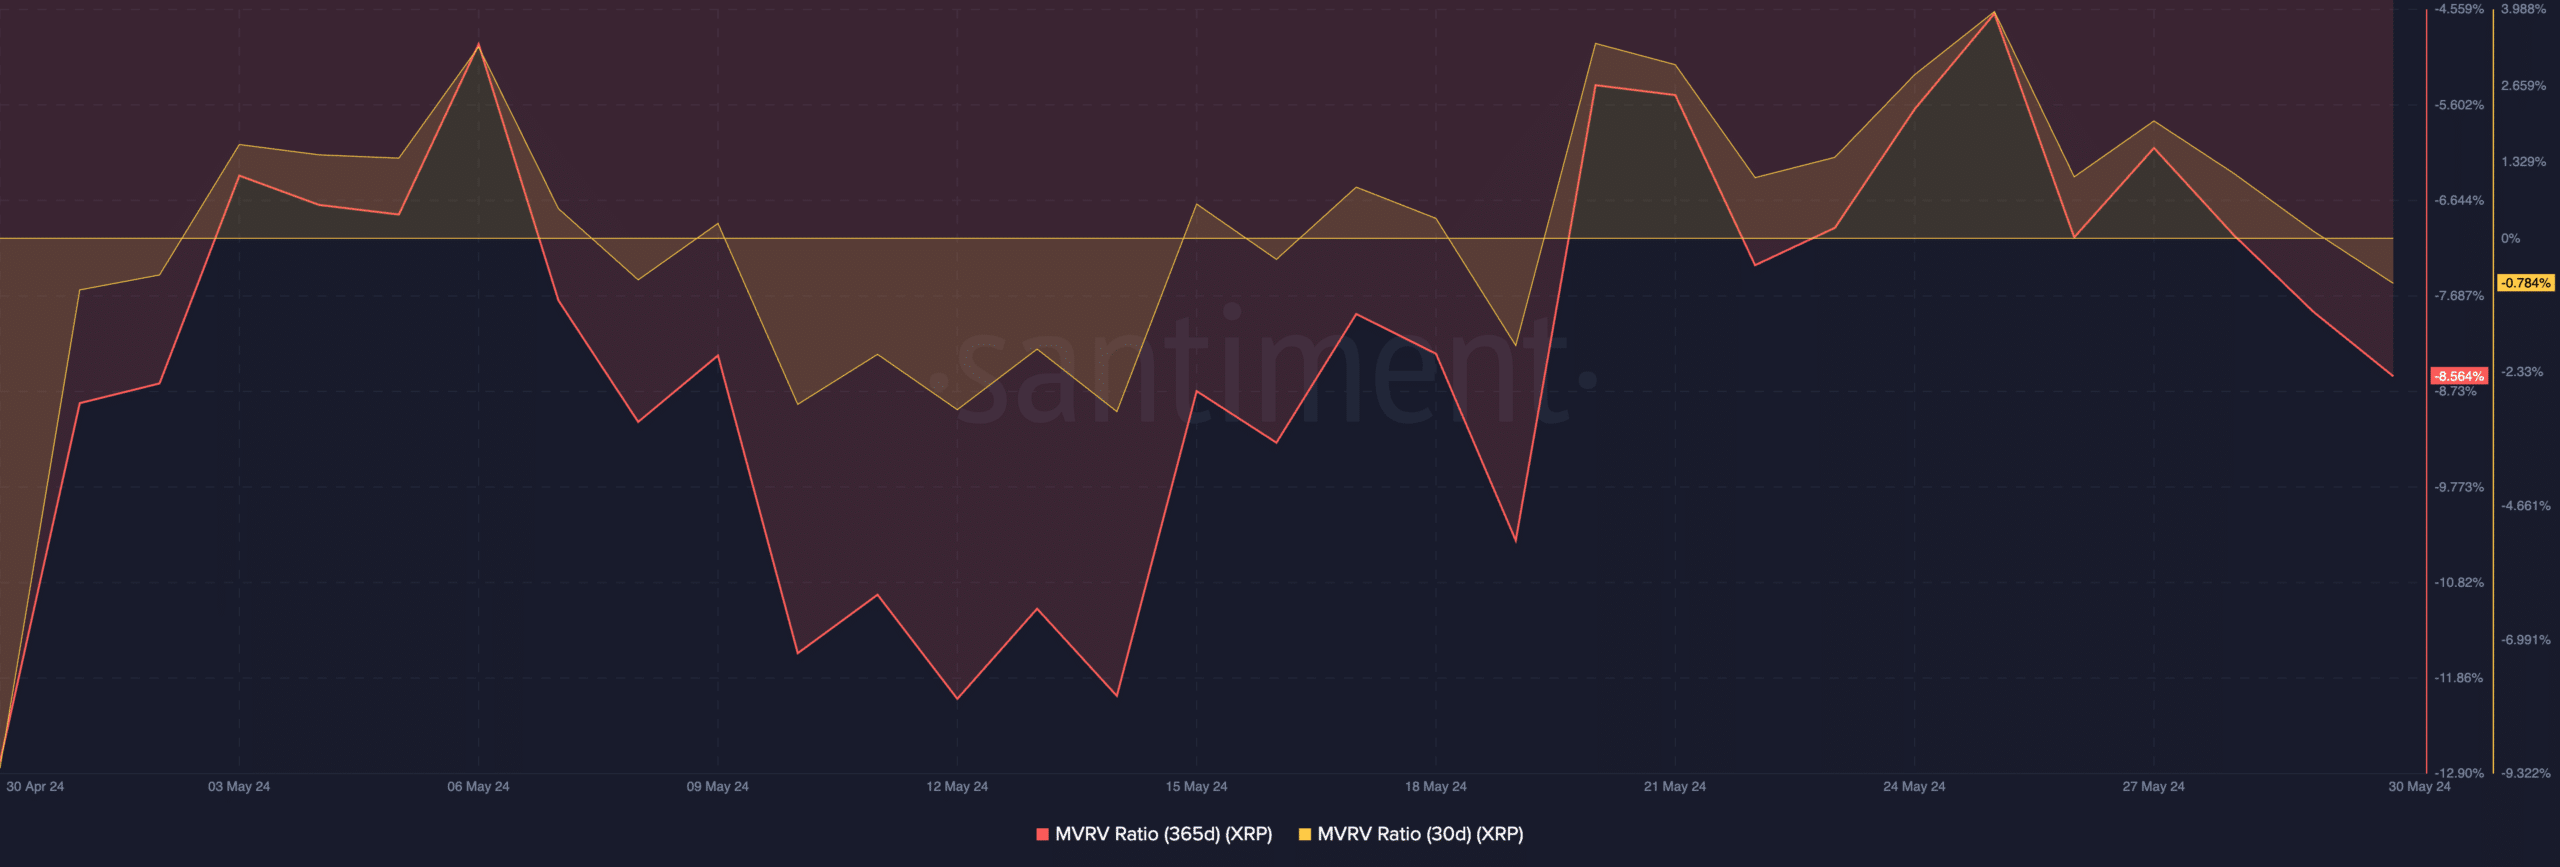
Source: Santiment
Realistic or not, here’s XRP’s market cap in BTC’s terms
When it is negative like this, the asset in question is undervalued. It signals that the current market value of that asset is less than the average purchase price of all its tokens in circulation.
It offers a good opportunity to buy because the asset trades at a discount relative to its historical cost basis.


