- XRP saw the selling pressure fade away in the past few days
- Another price move downward was still likely
Ripple [XRP] experienced some gains in the past week, but has yet to establish an uptrend. The trading volume picked up on Monday the 6th of May, the day of the court briefing.
The technical indicators and the price action did not favor a bullish bias.
The Weighted Sentiment was in decline, according to an AMBCrypto report. Another report highlighted that one metric indicated a potential price drop was imminent due to the age-consumed metric.
The mid-range resistance rebuffed the buyers yet again
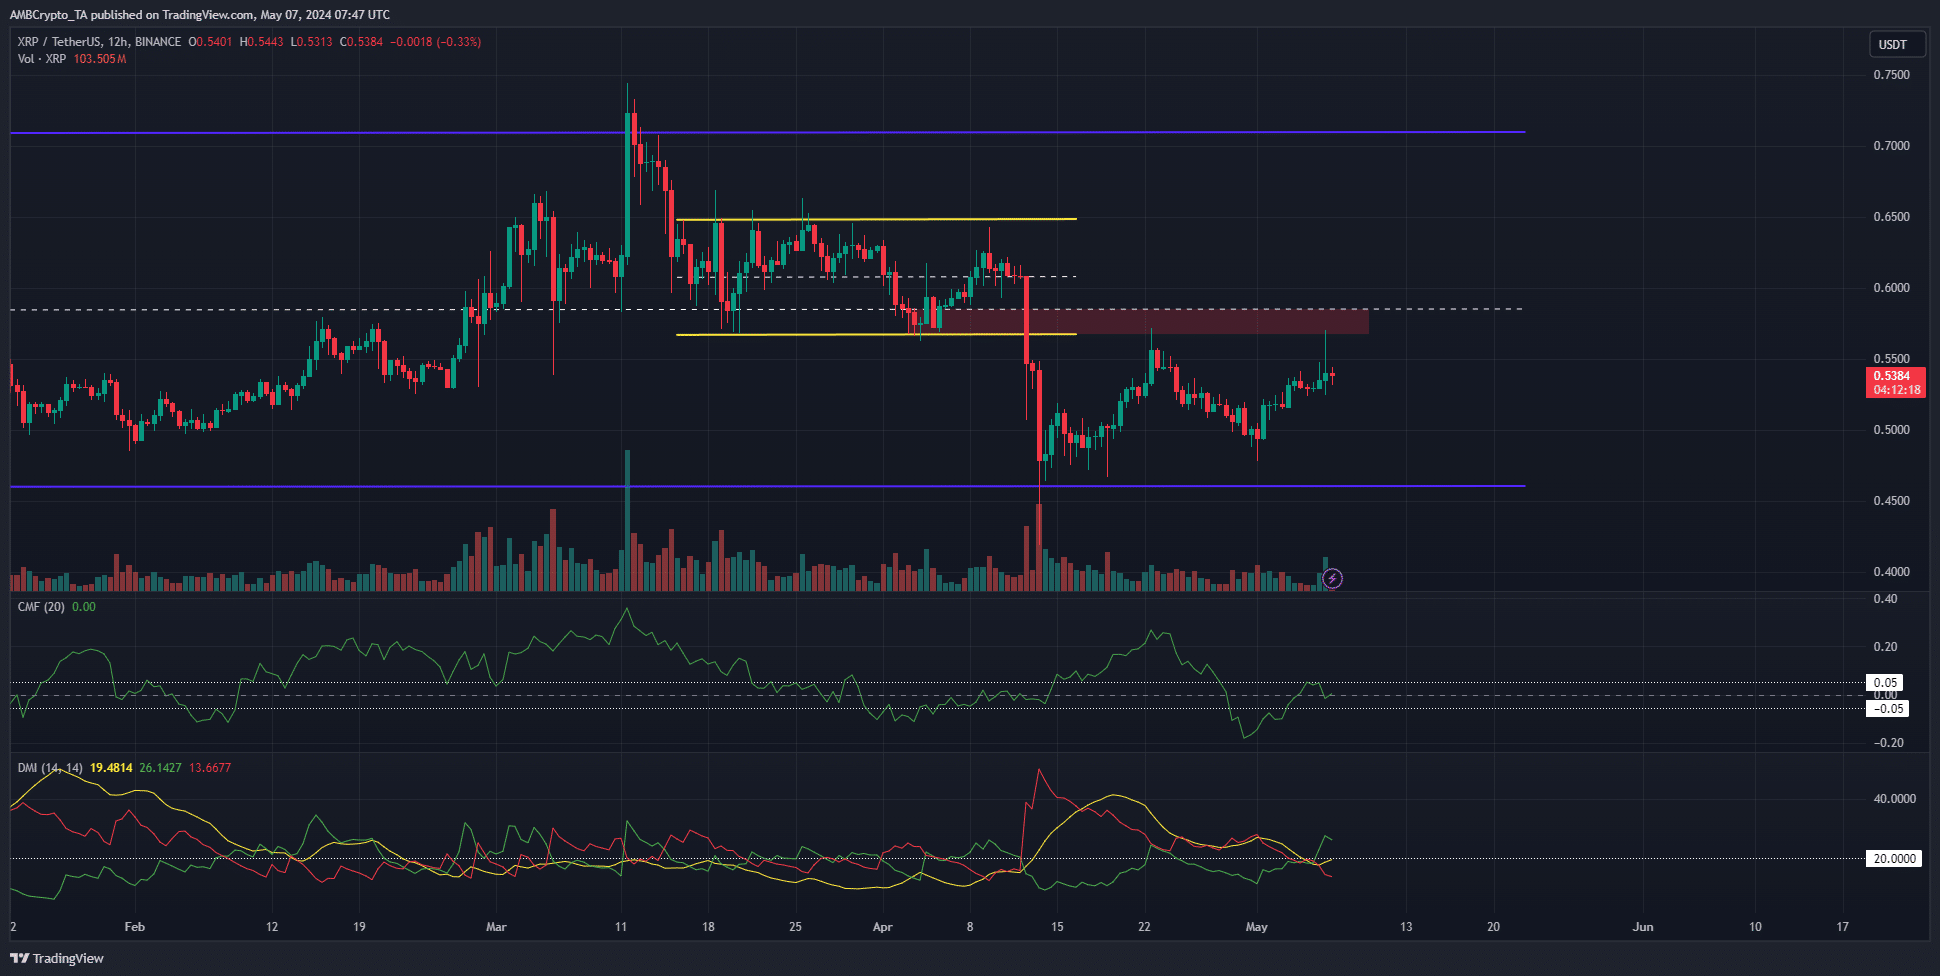
Source: XRP/USDT on TradingView
The nine-month XRP range (purple) extended from $0.46 to $0.71. The mid-range mark at $0.585 has acted as resistance since mid-March.
The resistance zone (red box) was also a bearish breaker block, implying a stronger resistance.
The Chaikin Money Flow was at 0 indicating a lack of significant capital flow into the market. The Directional Movement Index showed that the +DI (green) was above 26, and the ADX (yellow) was nearly 20.
This showed a strong uptrend was nearly in place. It remained to be seen whether this could propel XRP past the $0.585 resistance.
Therefore, a 5% move higher to $0.585 could be followed by a 15% slump to the $$0.48 support zone.
Has XRP reached a point of stability?

Source: Coinalyze
The Open Interest behind XRP has slowly trended higher over the past week. However, it was not a significant rally.
The price made gains of over 10% in the same period, but given the resistance overhead, speculators were anxious about going long on XRP.
One encouraging factor despite the bearish sentiment on the OI chart was the spot CVD. It has formed a bottom over the past three days, meaning the previously steady downtrend has ground to a halt.
This would be the first step in a recovery. It indicates that buying and selling pressure was balanced in the spot markets.
Read Ripple’s [XRP] Price Prediction 2024-25
Once the CVD begins to trend upward, it would be a sign of accumulation and reinforce the chances of an uptrend.
As things stand, XRP’s chances of a slump toward $0.48 were good given the age-consumed metric.
Disclaimer: The information presented does not constitute financial, investment, trading, or other types of advice and is solely the writer’s opinion.