XRP price prediction – How altcoin can hit new ATH of $4.26 after hiking by 53%
The 4-hour chart underlined a bearish divergence between the price and the RSI.

- XRP regained its bullish market structure on the daily charts
- The H4 divergence meant some consolidation around $2.7 is likely over the next few days
At press time, XRP seemed to have resolved its short-term range formation and climbed beyond the $2.5 resistance zone. The buying pressure increased over the last 48 hours, driving the crypto’s price higher. In an earlier analysis, it had been reported that the $2.5-$2.7 zone would need to be flipped to support, before the next higher timeframe uptrend.
That condition has been met, but the rest of the market is not yet bullish. Can XRP continue higher and make another 30% move? Even if Bitcoin [BTC] remains trapped below $100k?
XRP breaks bearish H4 structure, rebounds from key Fibonacci retracement level
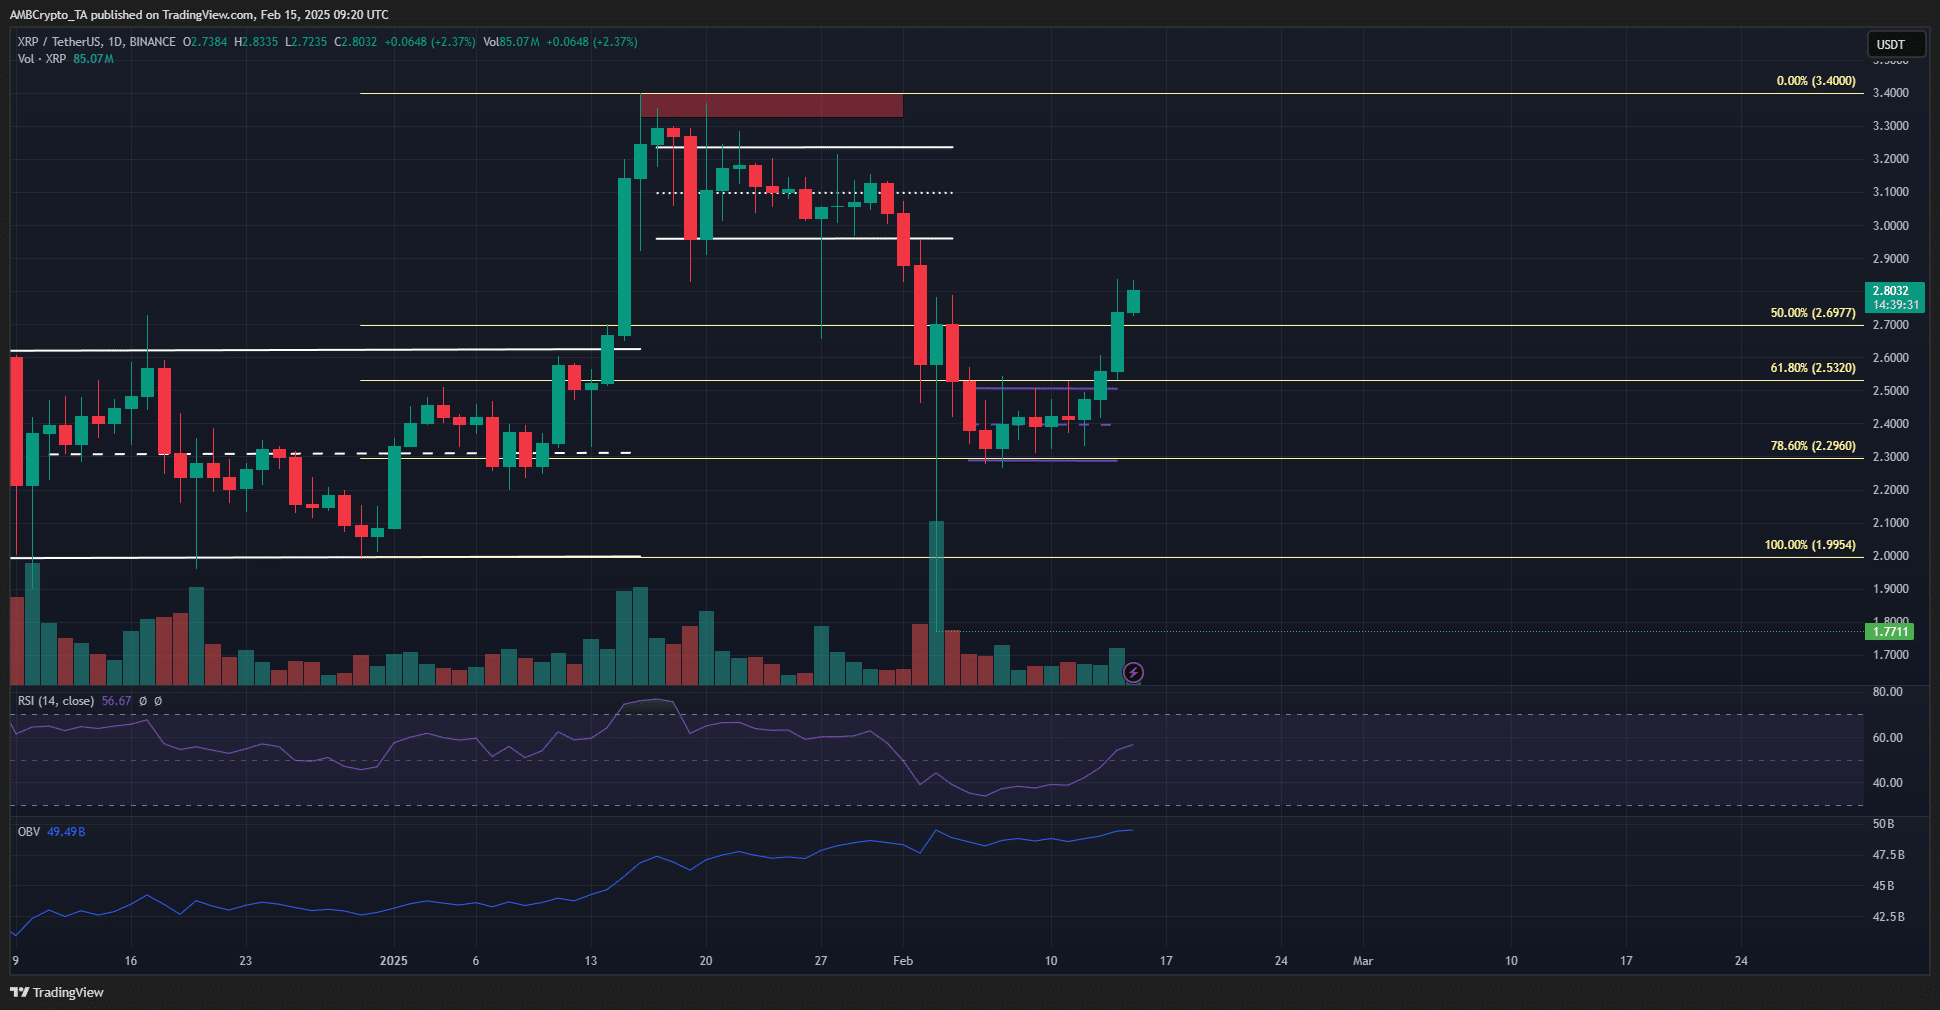
The daily chart revealed the RSI crossing over above neutral 50 to signal a shift in momentum. The OBV continued to trend higher. Despite the sharp price pullback in the first week of February, the OBV barely flinched. This was a sign that selling volume was low, and a rebound was likely.
That rebound has since occurred, and the question now is – Can XRP go even higher? The rebound came after a retest of the 78.6% Fibonacci retracement level, where a range formation was seen.
A recovery from this level is usually pushed towards the 23.6% and 61.8% extension levels. Hence, the longer-term targets for XRP for this leg upwards would be at $3.73 and $4.26. Over the next 2-3 weeks, however, the local highs would be the target.
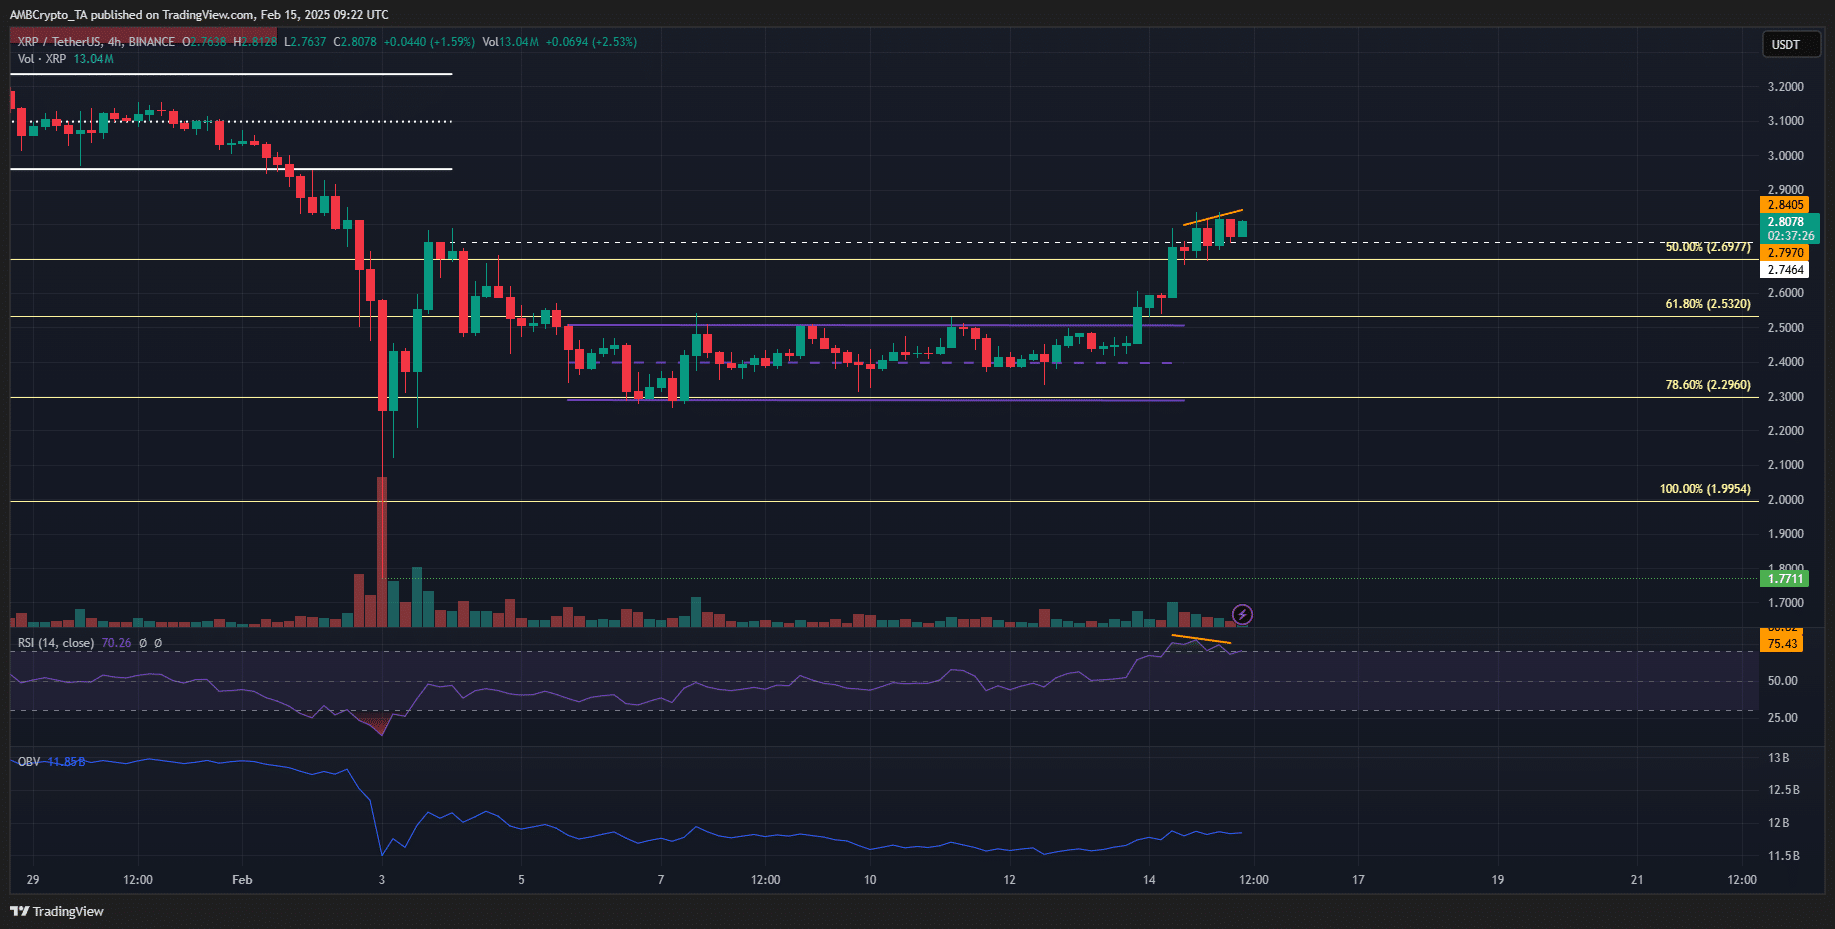
The 4-hour chart highlighted a bearish divergence between the price and the RSI. Meanwhile, the OBV maintained its flat trend. Together, they suggested that the price could be set for a consolidation phase at around $2.7 over the next few days.
A consolidation can be expected too, and not a pullback. Especially since XRP broke key short-term resistance levels. The price cannot be anticipated to go lower than the fair value gap at $2.6-$2.68.
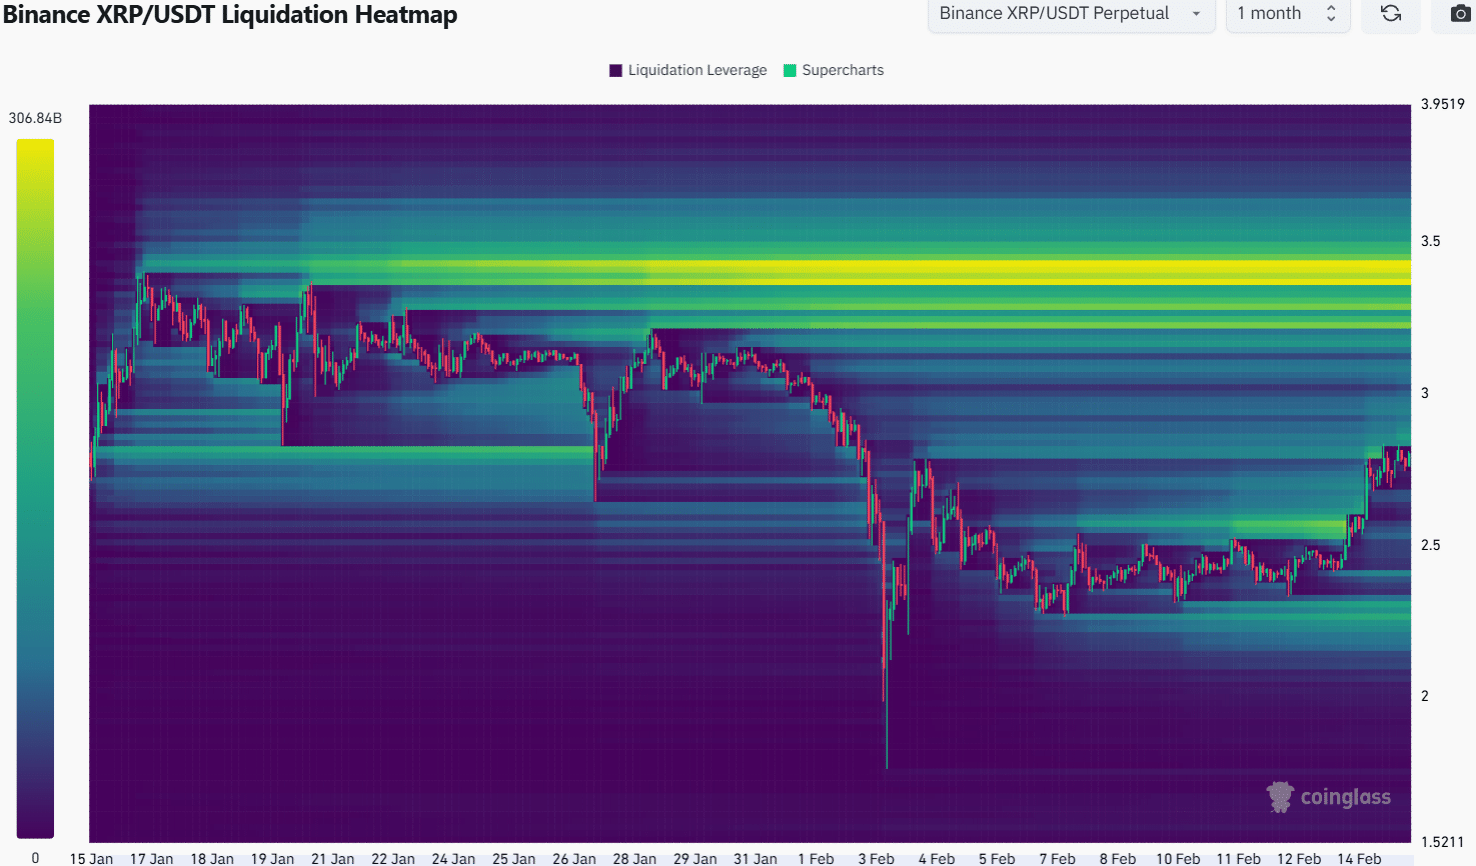
The previous month’s liquidation heatmap signaled some liquidity pockets building up around the price. The $2.86 zone seemed to be close and had a decent number of liquidations, making it the next likely target.
Further north, the $3.37-$3.43 zone would be the next key magnetic zone. The number of liquidations in this region means that there is a high chance the price may be drawn to these levels.
Disclaimer: The information presented does not constitute financial, investment, trading, or other types of advice and is solely the writer’s opinion