Ripple

XRP price prediction – Identifying the SMAs that will dictate trend reversal
Posted:
Journalist

- XRP’s downward pressure may be losing momentum
- Market bears still retain significant influence across the market though
XRP’s long-term downtrend has been weakening lately, with the gap between its 50-day (blue) and 200-day (yellow) simple moving averages (SMAs) on the weekly chart growing narrower by the day.
An asset’s 50-day SMA is a shorter-term average that reflects its recent price movements. On the other hand, the 200-day SMA is a longer-term average that indicates an asset’s general trend direction.
When the gap between the two moving averages narrows and the 50-day SMA rests below the 200-day SMA, as in XRP’s case, it often suggests a weakening downtrend. It means that XRP’s shorter-term average is approaching its longer-term average, thus indicating a loss of downward momentum.
Bears may have it all
Although the downward pressure on XRP may be weakening, readings from other key technical indicators revealed that bearish sentiments remain high.
For example, its Chaikin Money Flow (CMF), which measures the flow of money into and out of the asset, was negative at press time and has been so since March. A negative CMF value indicates a spike in market selling pressure or coin distribution. It suggests that an asset is being sold more than it is being bought, and money is flowing out of the asset.
Confirming the decline in XRP accumulation, its Accumulation/Distribution Line (ADL) was also on a downtrend at press time.
This indicator tracks the cumulative flow of money in and out of an asset over a given period. When it falls in this manner, it means more market participants are selling than they are buying.
Read Ripple’s [XRP] Price Prediction 2024-25
Furthermore, XRP’s Squeeze Momentum Indicator, which measures its momentum and tracks the consolidation phase of the market for traders looking to trade in a sideways market, flashed red downward-facing bars. This indicator’s value has been negative since January.
When it displays these kinds of bars, the asset in question is recording southbound momentum.
The token’s negative directional index (red) was above its positive index (green), suggesting that XRP’s bear power outweighed its bull strength. When these lines trend in this manner, selling pressure exceeds buying momentum on the charts.
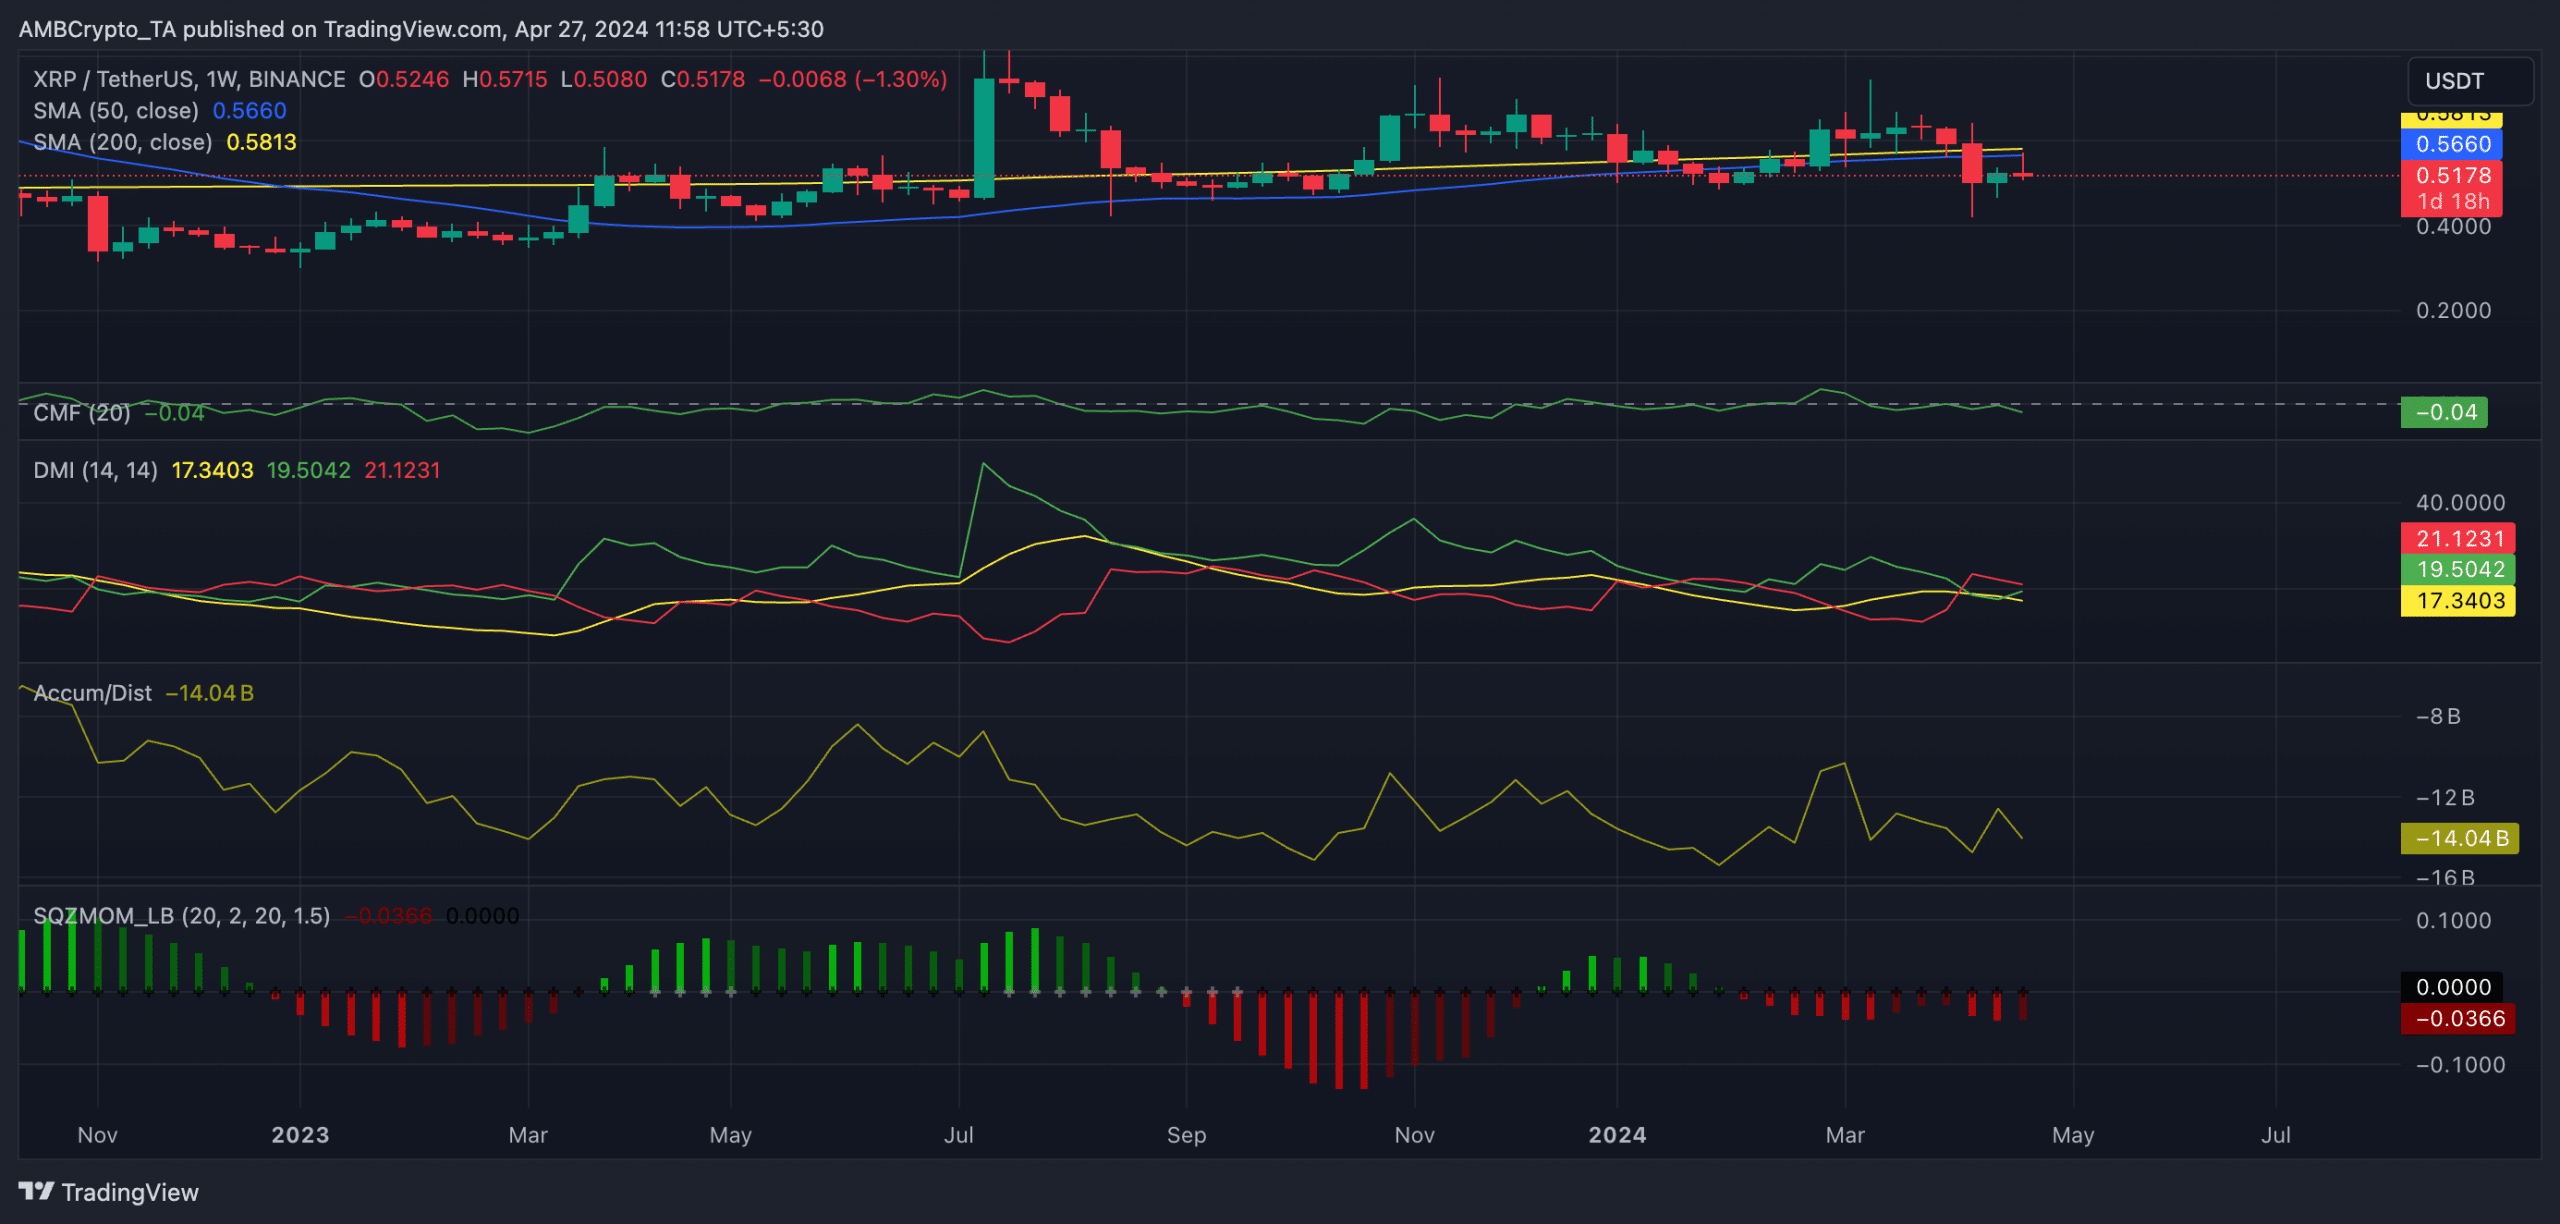
Source: XRP/USDT on TradingView
At press time, XRP was valued at $0.51. Over the past month, its value has fallen by almost 20%, according to data from CoinMarketCap.