Will XRP’s price see another 8% drop? New predictions suggest…

- XRP could descend toward the mid-range level which is another ~8% drop.
- The buyers have lost their dominance over the past week.
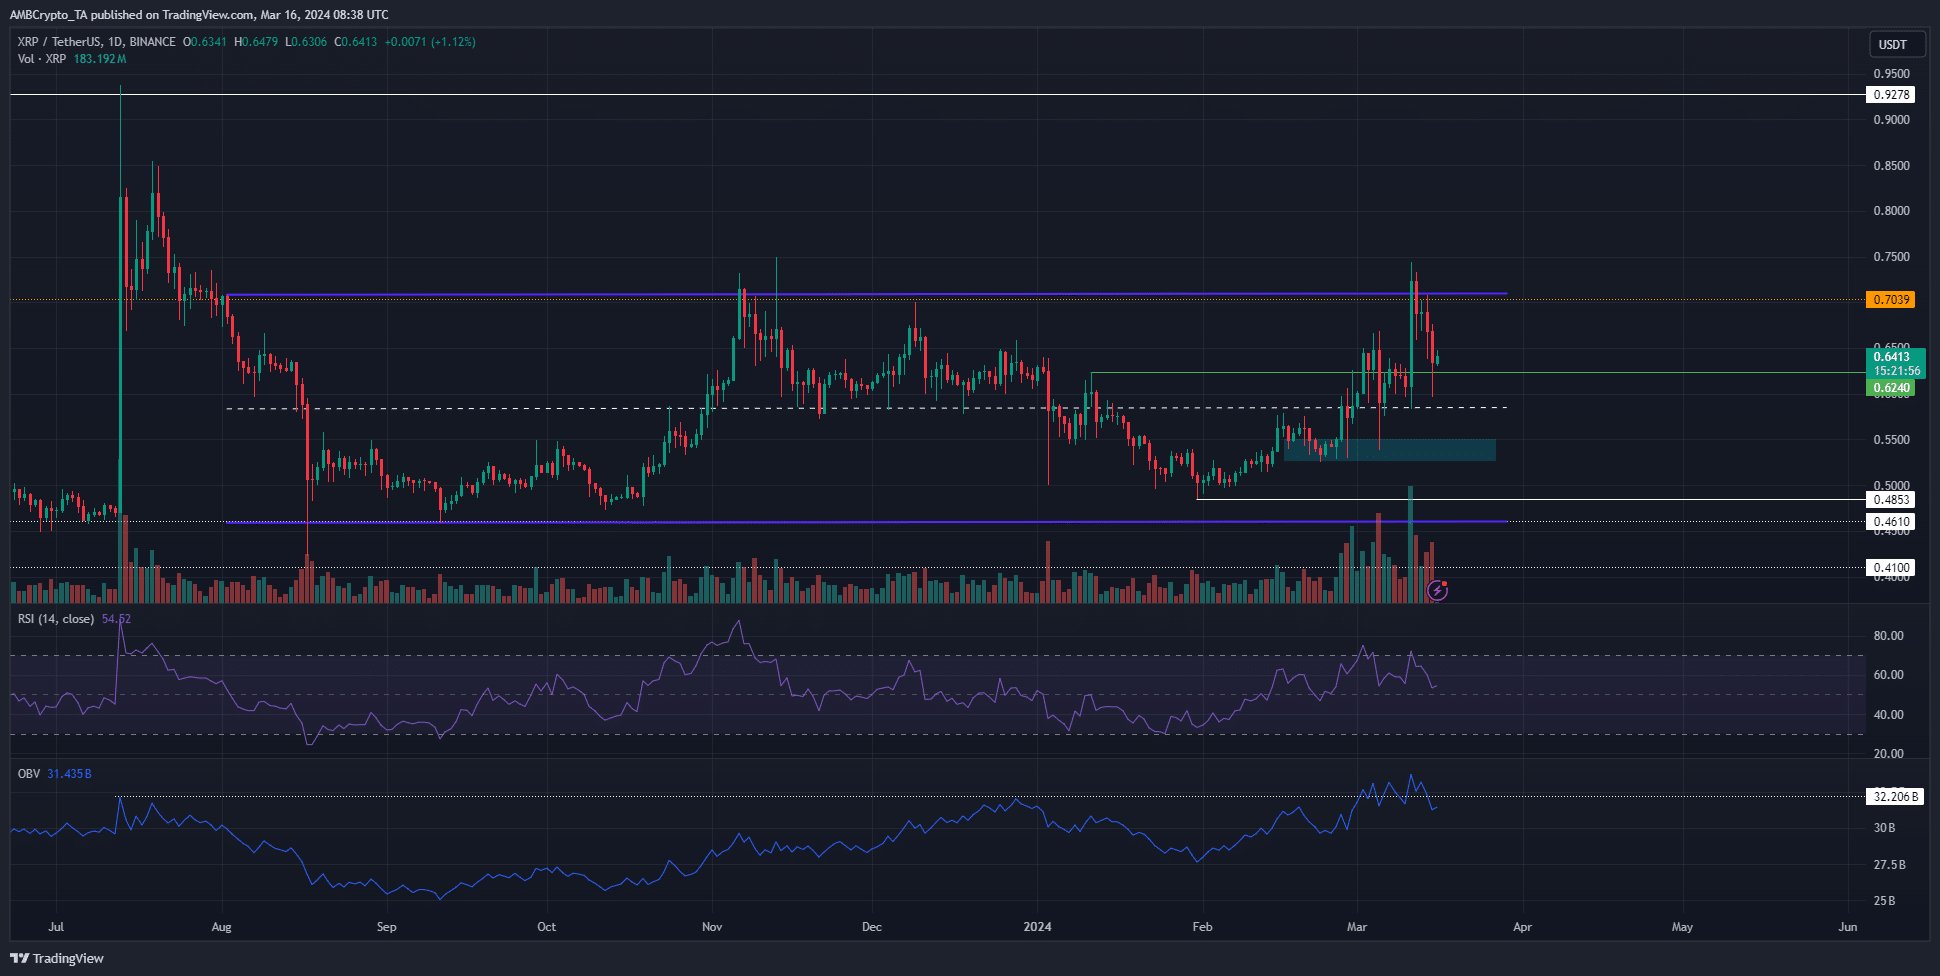
Ripple [XRP] saw a rejection from its 7-month range highs at the $0.71 level. This move and the subsequent rejection happened pretty much as laid out in an AMBCrypto analysis from a week ago.
A look at its on-chain metrics earlier this week suggested that accumulation was underway and investors were confident. However, it remains to be seen on the price chart, with the $0.7 level still looming large.
The market structure maintains a bullish bias
The daily chart of XRP showed that despite the near 15% pullback in the past five days, the market structure remained bullish. A move below $0.525 is necessary to change this.
The RSI also remained above neutral 50, but with a reading of 54, it showed that momentum was neutral.
The OBV was unable to defend a resistance level that it appeared to flip to support last week. This saw the indicator fall as selling pressure climbed. Together, the indicators signaled that the bulls were having a hard time.
The $0.624 is a lower timeframe support level that might not hold. The mid-range level at $0.585 and the $0.52-$0.54 region were two key demand zones where XRP could see a bullish reaction.
Selling pressure continues to increase on the shorter timeframes

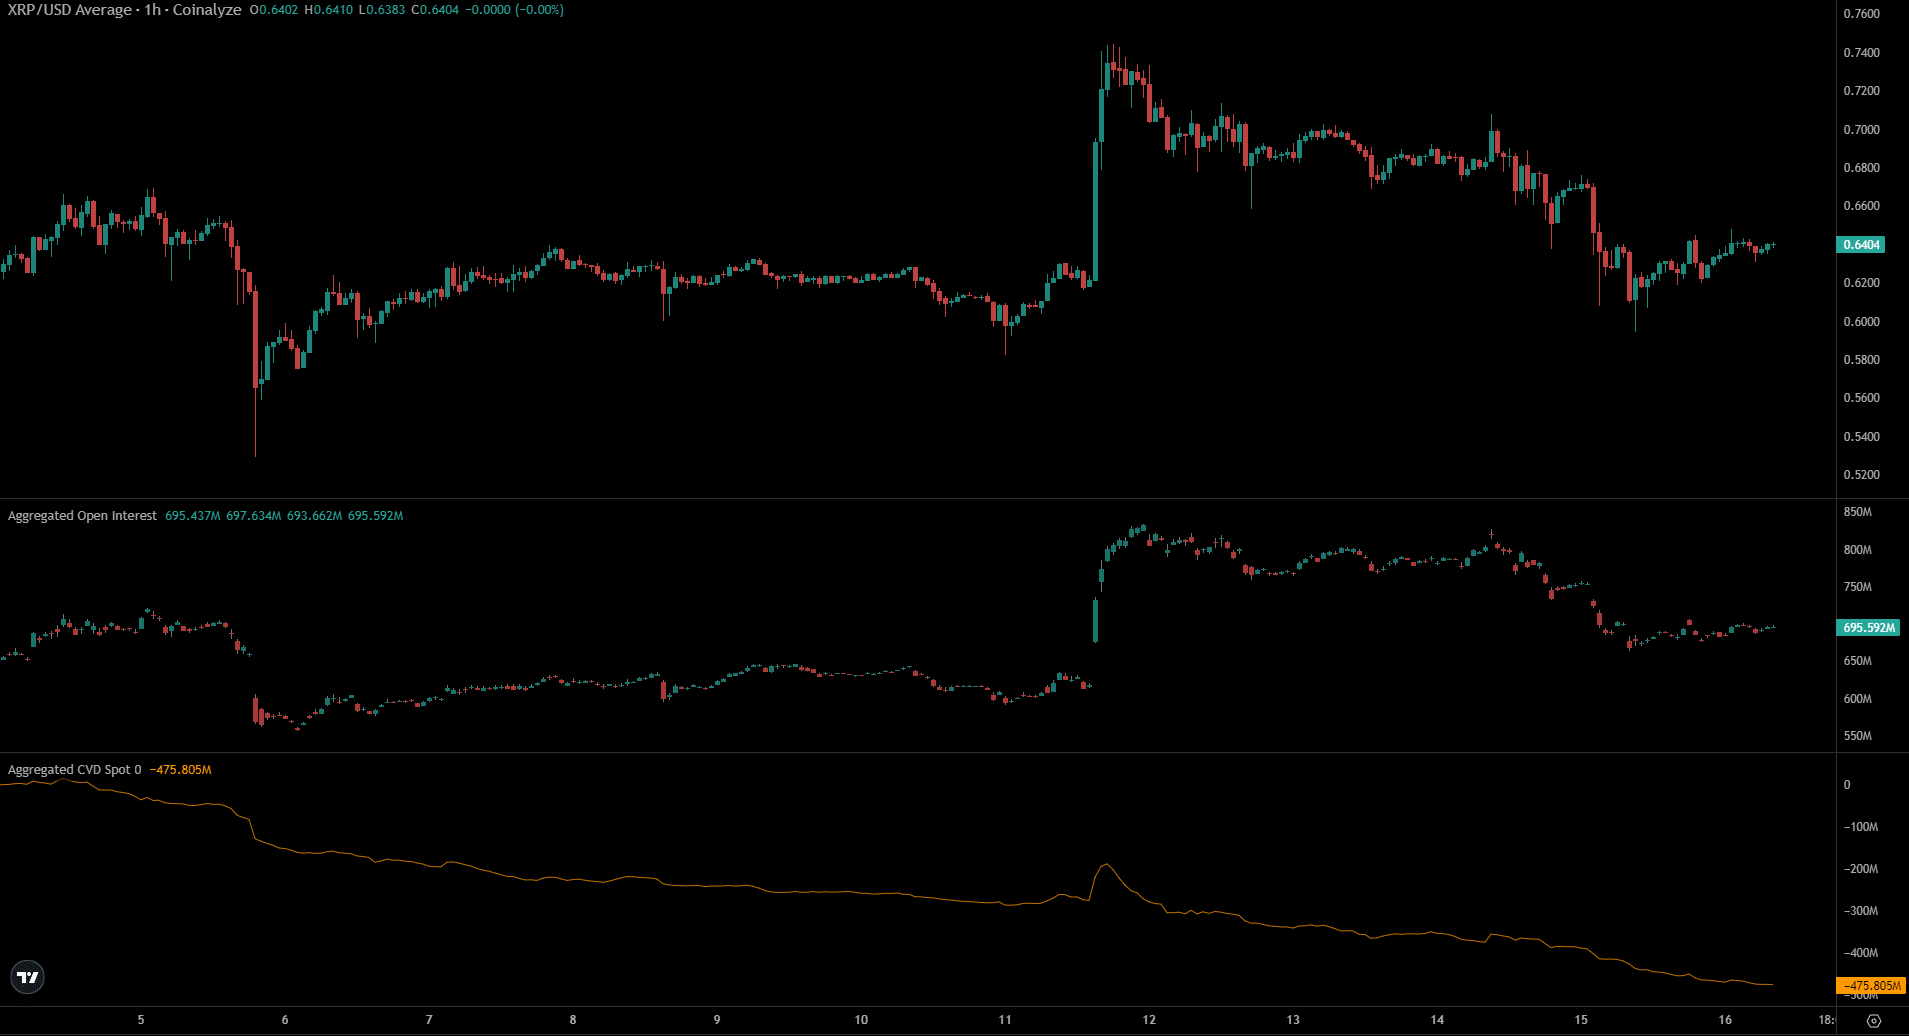
Source: Coinalyze
The Open Interest behind XRP has dwindled steadily since the 14th of March. Alongside the falling prices, the inference was that bearish sentiment has set in. Speculators were not prepared to bet on XRP to reverse its short-term downtrend.
How much are 1, 10, or 100 XRP worth today?
Meanwhile the spot CVD has headed southward since the 5th of March. The lack of demand in the spot markets was something that was a concern to long-term holders.
Disclaimer: The information presented does not constitute financial, investment, trading, or other types of advice and is solely the writer’s opinion.


