XRP retests support zone: Bulls can look to book profits here

Disclaimer: The information presented does not constitute financial, investment, trading, or other types of advice and is solely the writer’s opinion.
- XRP consolidated beneath the highs of a range over the past three weeks.
- This consolidation can see a breakout provided Bitcoin defends $22.3k.
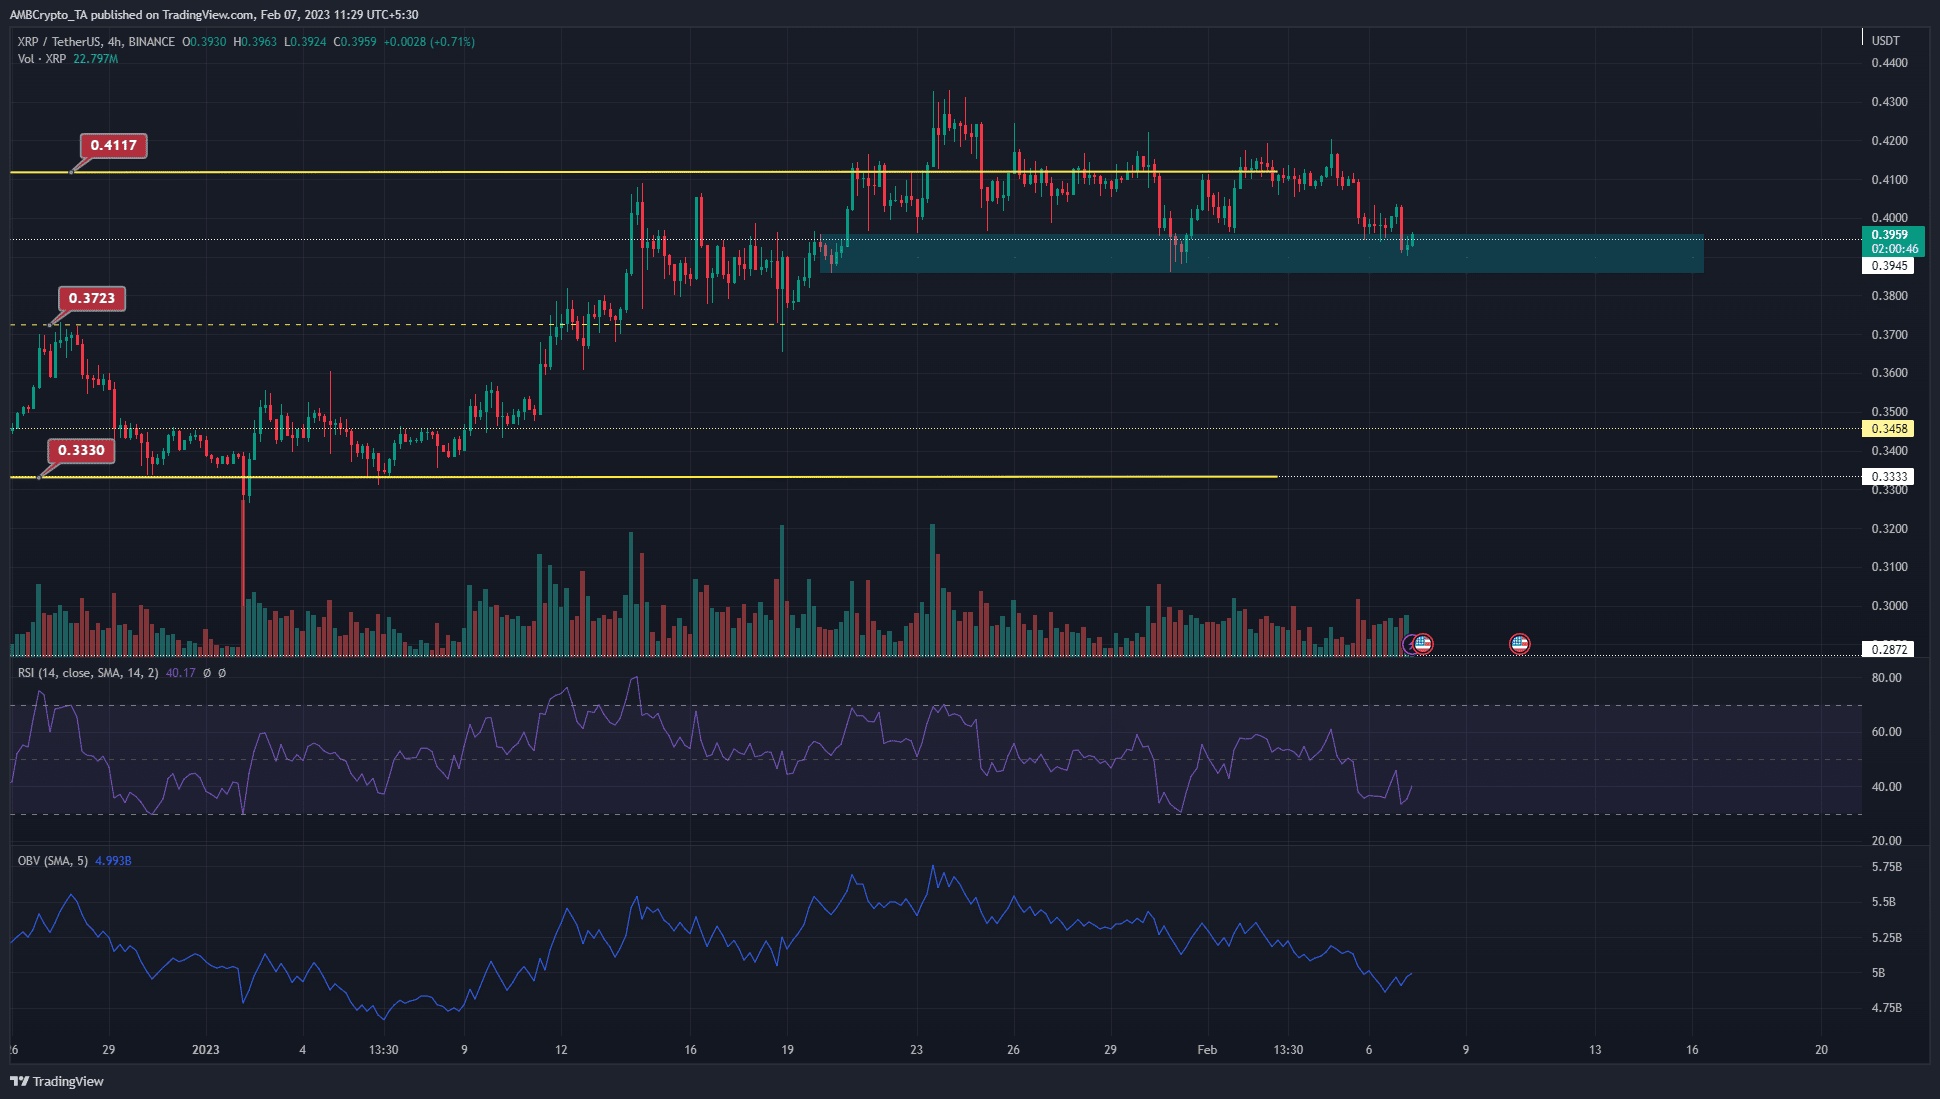
Ripple [XRP] saw some volatility in the price charts in the past two weeks. A breakout past $0.412 was reversed rapidly, but the region of support at $0.39 has been defended thus far. The price consolidated beneath the $0.412 range highs.
How much is 1, 10, 100 XRP worth?
During this consolidation, the price formed another lower timeframe range. Meanwhile, Bitcoin [BTC] has a bullish bias so long as it trades above the $22.3k area. What can be expected from XRP on the charts this week?
A 12-hour bullish order block was retested: Can buyers expect a strong reaction
The price has made equal highs and equal lows in the past week. XRP ranged from $0.39 to $0.416 since 30 January. In this period, the OBV slipped downward to show sellers were dominant. The RSI attempted to climb above the 60 mark, but was beaten back. At press time, it stood at 40 to show bearish momentum.
In the daily timeframe, the market structure was bullish. This bias would flip to bearish if a daily trading session closed below the $0.386 mark. To add further confluence to this bullish bias, the area marked in cyan is a 12-hour bullish order block.
Near-term bulls can look to buy XRP just above the $0.39 level and book a profit on the retest of the resistance at $0.41. Breakout traders can wait for a move above $0.42 and a subsequent bullish retest to buy. Similarly, sellers can wait for a descent below $0.38 and a bearish retest to enter short positions targeting the mid-range mark at $0.373.
Realistic or not, here’s XRP’s market cap in BTC’s terms
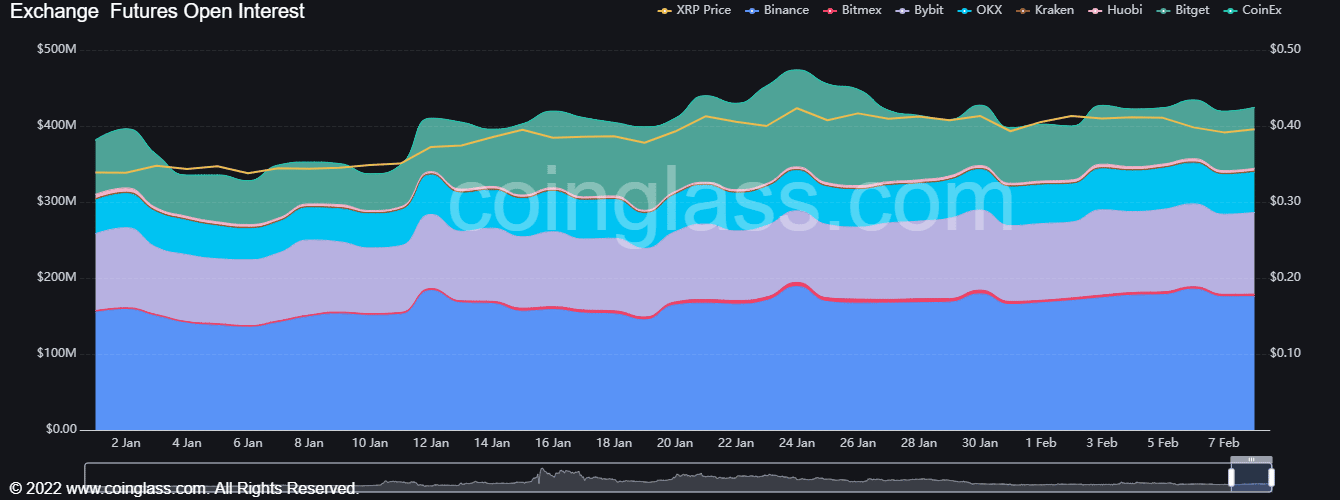
Open Interest sees a small dip as prices flattened

Source: Coinglass
The Open Interest chart showed OI has fallen since January 24. In this period, XRP faced rejection at $0.426 and could not break above $0.416 in the past few days. The inference is that bullish sentiment was weakening. A breakout past $0.42 alongside a surge in OI will probably show strong bullish momentum.
The funding rate data showed positive rates across major exchanges. This meant that long positions paid the short sellers, hinting at a bullish outlook.


![dogwifhat's [WIF] 3-day rally has eyes glued, yet a hidden risk lurks](https://ambcrypto.com/wp-content/uploads/2025/04/Gladys-8-400x240.jpg)
