XRP rises 5% in 7 days, but it could fall soon – Why?
XRPL introduces new features, but the broader market remains unimpressed.

- Ripple has introduced an automated market maker feature on XRP Ledger.
- Key indicators hinted at a possible decline in XRP’s value.
Over 200 liquidity pools have been created on the network since the launch of the long-anticipated automated market maker (AMM) feature on XRP Ledger (XRPL), data from XRPScan showed.
AMM is now live on XRPL mainnet! First few pools are rolling in 😀 – https://t.co/RR0LsMcvEG pic.twitter.com/epnT2QESzS
— XRPScan (@xrpscan) March 22, 2024
In a blog post published on the 22nd of March, the developer team behind XRPL announced the launch of the XLS-30. This allowed for the integration of the AMM feature on the XRPL.
According to the developers, this marked a significant upgrade from the preexisting XRPL decentralized exchange (DEX) structure.
This provided liquidity exclusively through manual market making and central limit order books.
With the XLS-30, a non-custodial AMM feature is added to the XRPL DEX. It allows users to earn returns for providing liquidity to the network’s pools.
According to XRPScan, the biggest liquidity pool on the network is the USD/USD pair, which has a balance of 5 trillion LPToken.
Much ado about nothing
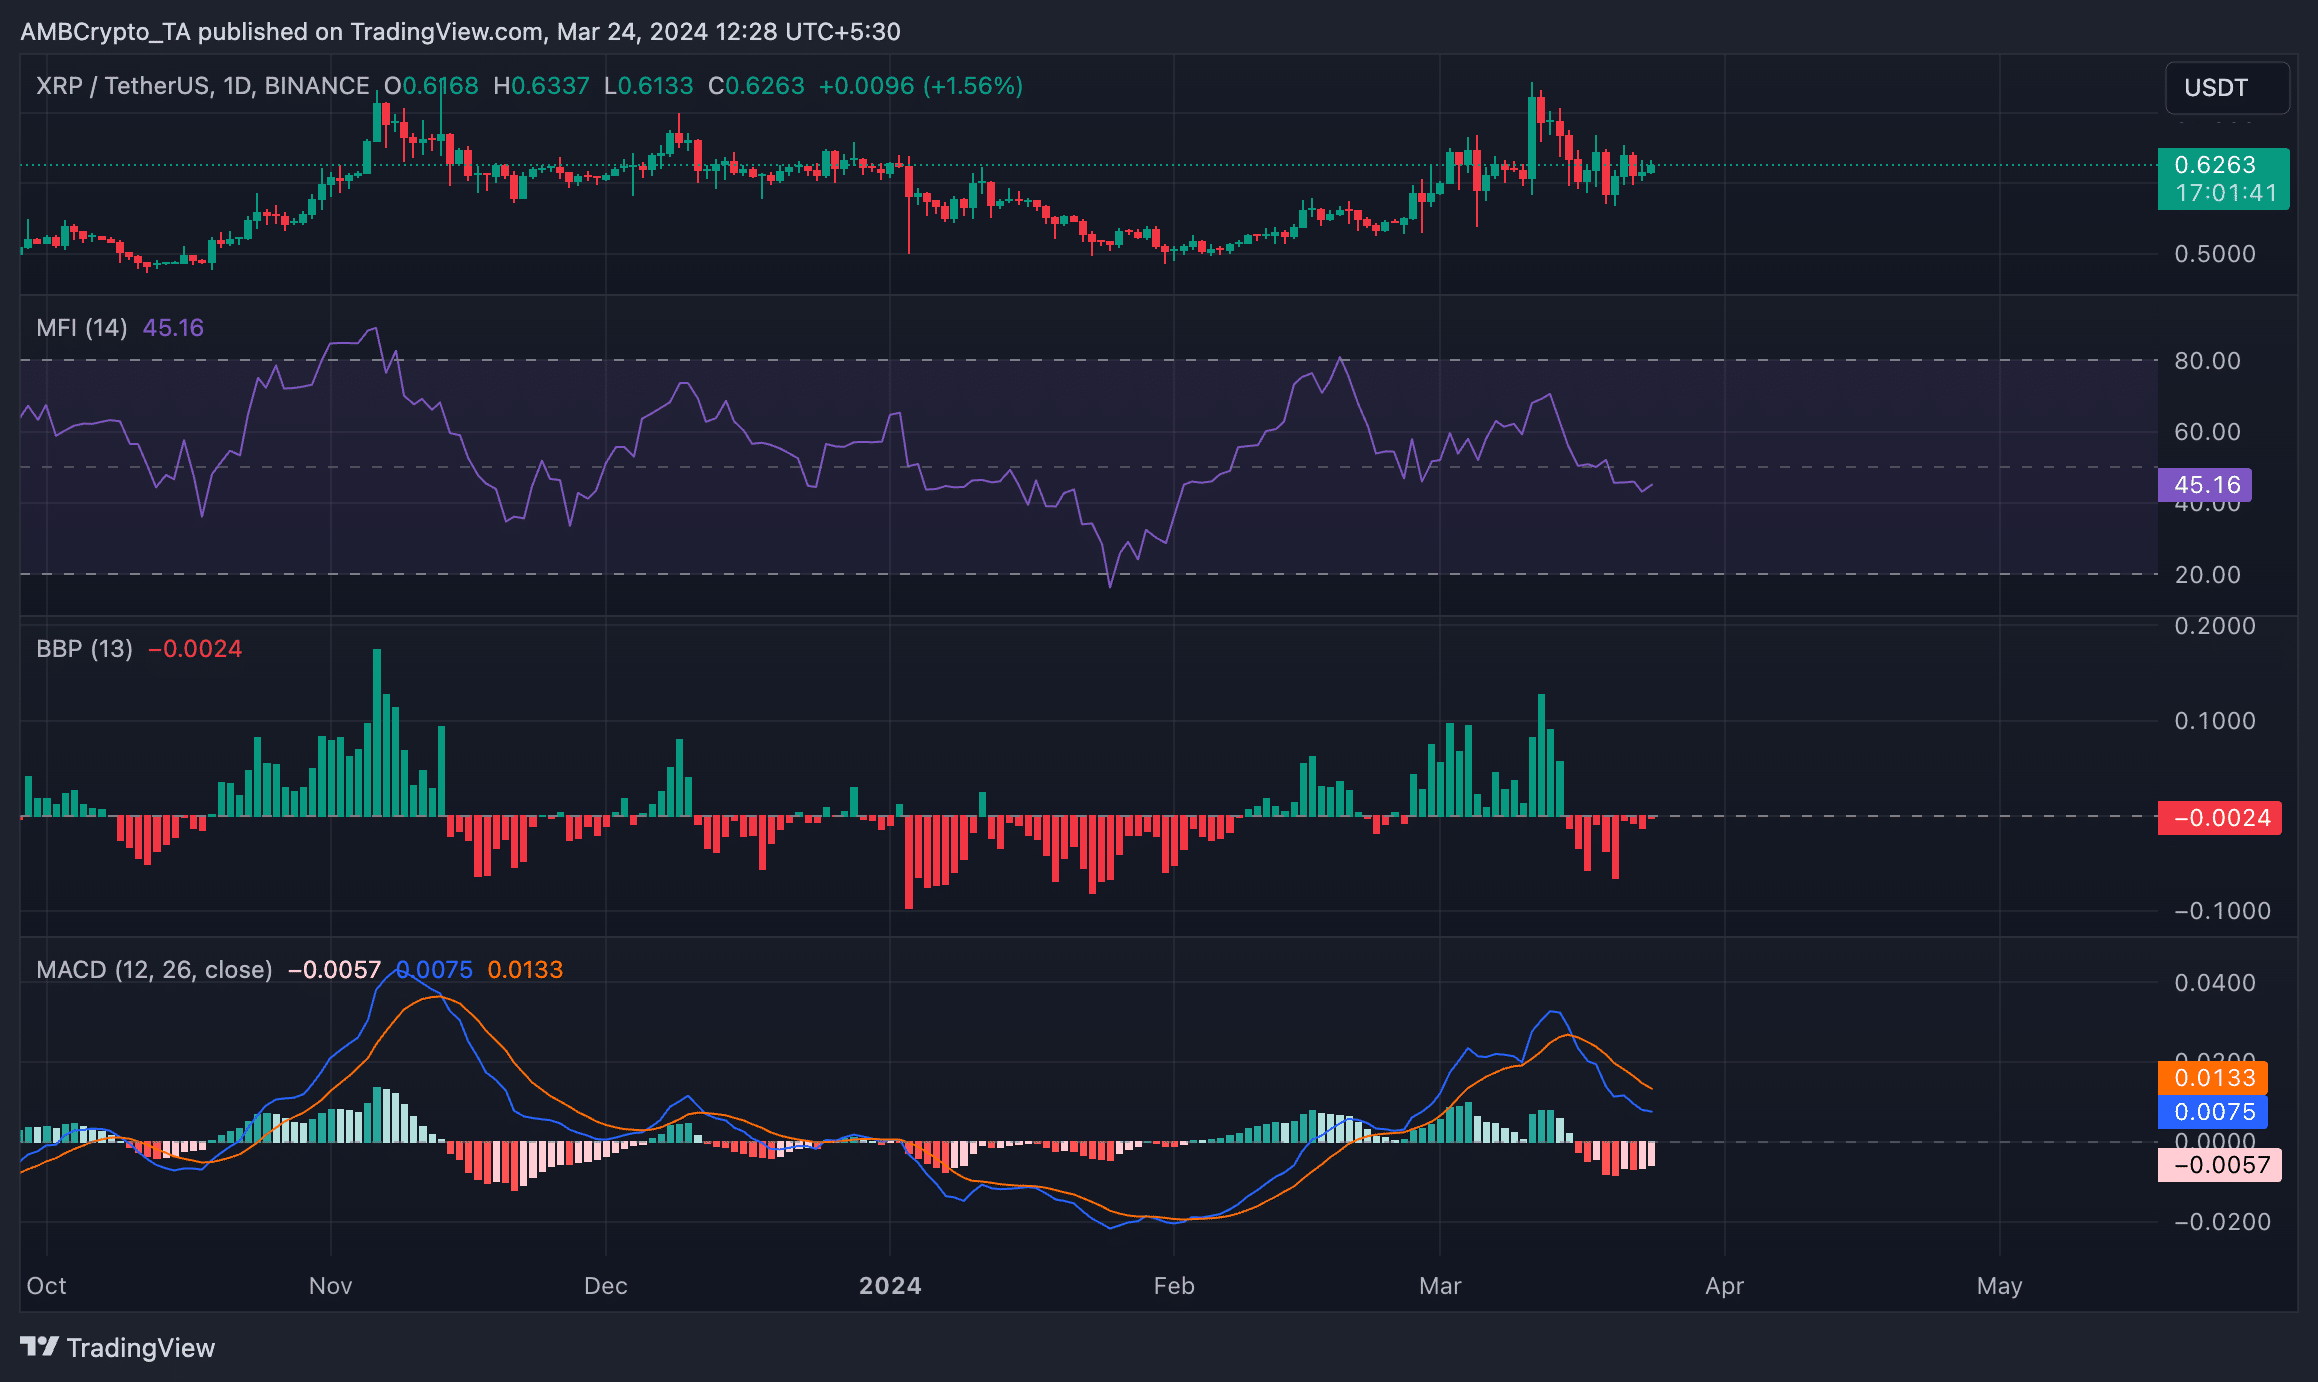
According to CoinMarketCap’s data, XRP traded at $0.63 at press time.
While its value rose by almost 5% in the last week, an assessment of some indicators on a daily chart revealed that it may witness a drawback in the coming week.
For example, the value of its Elder-Ray Index, which estimates the relationship between the strength of buyers and sellers on an asset, was -0.0028.
A negative Elder-Ray Index value is a bearish signal, depicting an uptick in selling activity.
Also, readings from XRP’s Money Flow Index (MFI) confirmed the decline in demand for the altcoin. At press time, the value of XRP’s MFI was 45.16, positioned in a downtrend.
This suggested a decrease in accumulation momentum and a preference for sell-offs amongst market participants.
Lastly, poised to cross below the zero line, the token’s MACD was under the signal line as of this writing.
Realistic or not, here’s XRP’s market cap in BTC’s terms
A downward intersection of the MACD line with the signal line suggests that the short-term moving average is trending lower than the longer-term moving average.
It represents a decline in bullish momentum and is often interpreted as a sign that a price decline may happen.
![Will Strategy's [STRC] collapse force more Bitcoin sell-offs? Analysts weigh in](https://ambcrypto.com/wp-content/uploads/2026/06/StrategySTRCFI-e1781864240722.jpeg)