


Disclaimer: The information presented does not constitute financial, investment, trading, or other types of advice and is solely the writer’s opinion
- The daily timeframe charts of XRP have been bearishly biased since late October
- The range formation in early November was respected, but another wave of selling is expected
XRP traded within a range after the sell-off during the FTX saga. The lows of this range offered support once more in recent days, but it was likely that a move upward would offer sellers another opportunity.
Read XRP’s Price Prediction 2023-24
Bitcoin has been extremely still in recent days. A breakout toward or past $18.2k for BTC could trigger a shift in sentiment across the altcoin market. Until then, it remained likely that shorting any bounces in price would be profitable.
The liquidation of long positions was followed by a reversal but demand was not strong
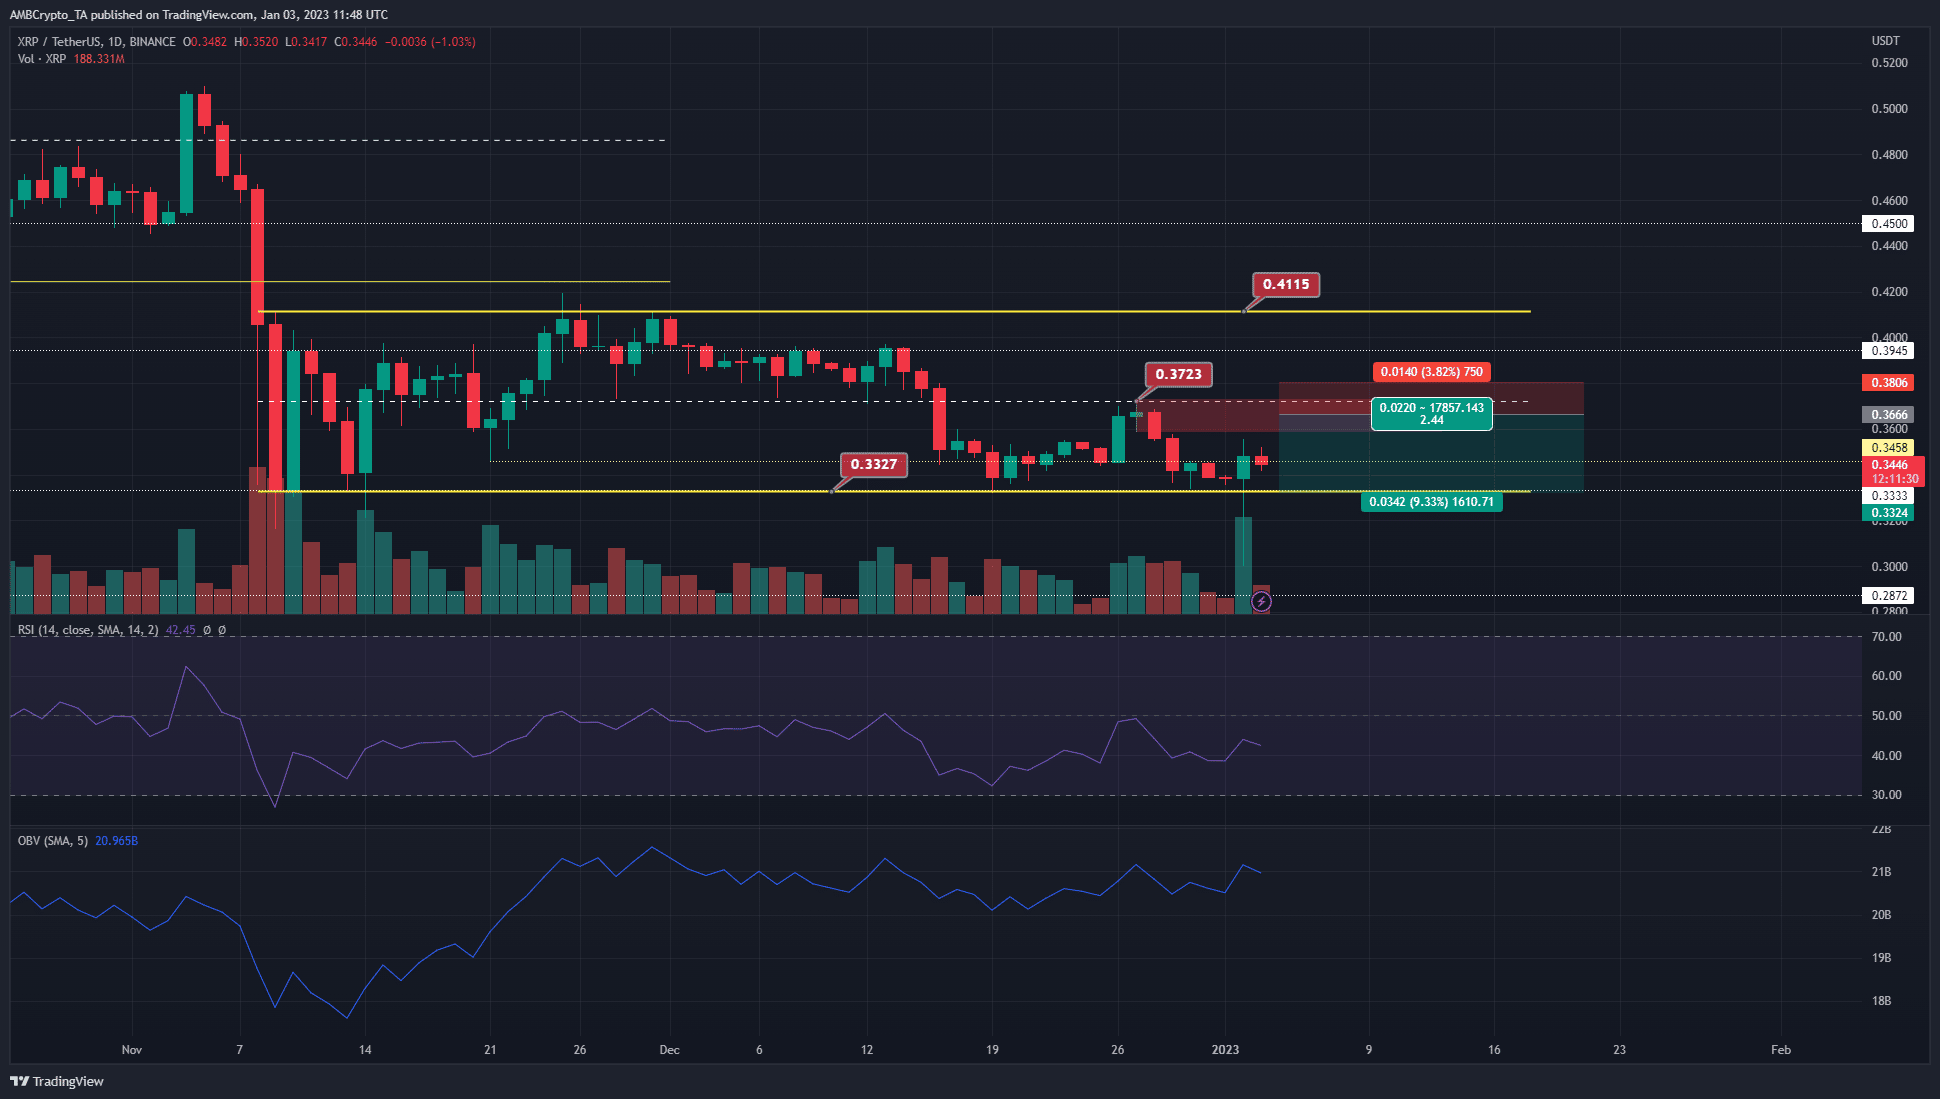
The market structure of XRP flipped bearish when the price slid beneath the mid-range mark at $0.37 on 16 December. Since then, the price has tested the range lows at $0.333 as support and bounced back to $0.37.
This bounce saw XRP form a bearish order block, a region dominated by sellers. Combined with the bearish market structure on the daily timeframe, it indicated that a revisit to this region of resistance was likely to face rejection once again.
Hence, short sellers can look to enter near the $0.362-$0.37 area. Their stop-loss can be set in the vicinity of $0.375, as a move above $0.374 would invalidate the bearish idea. Traders can also look to manually close the trade on a daily session close above $0.373, leaving more room for upward wicks.
To the south, bearish targets include $0.333 and $0.3 for ambitious bears.
Both long and short positions were liquidated while Open Interest declined
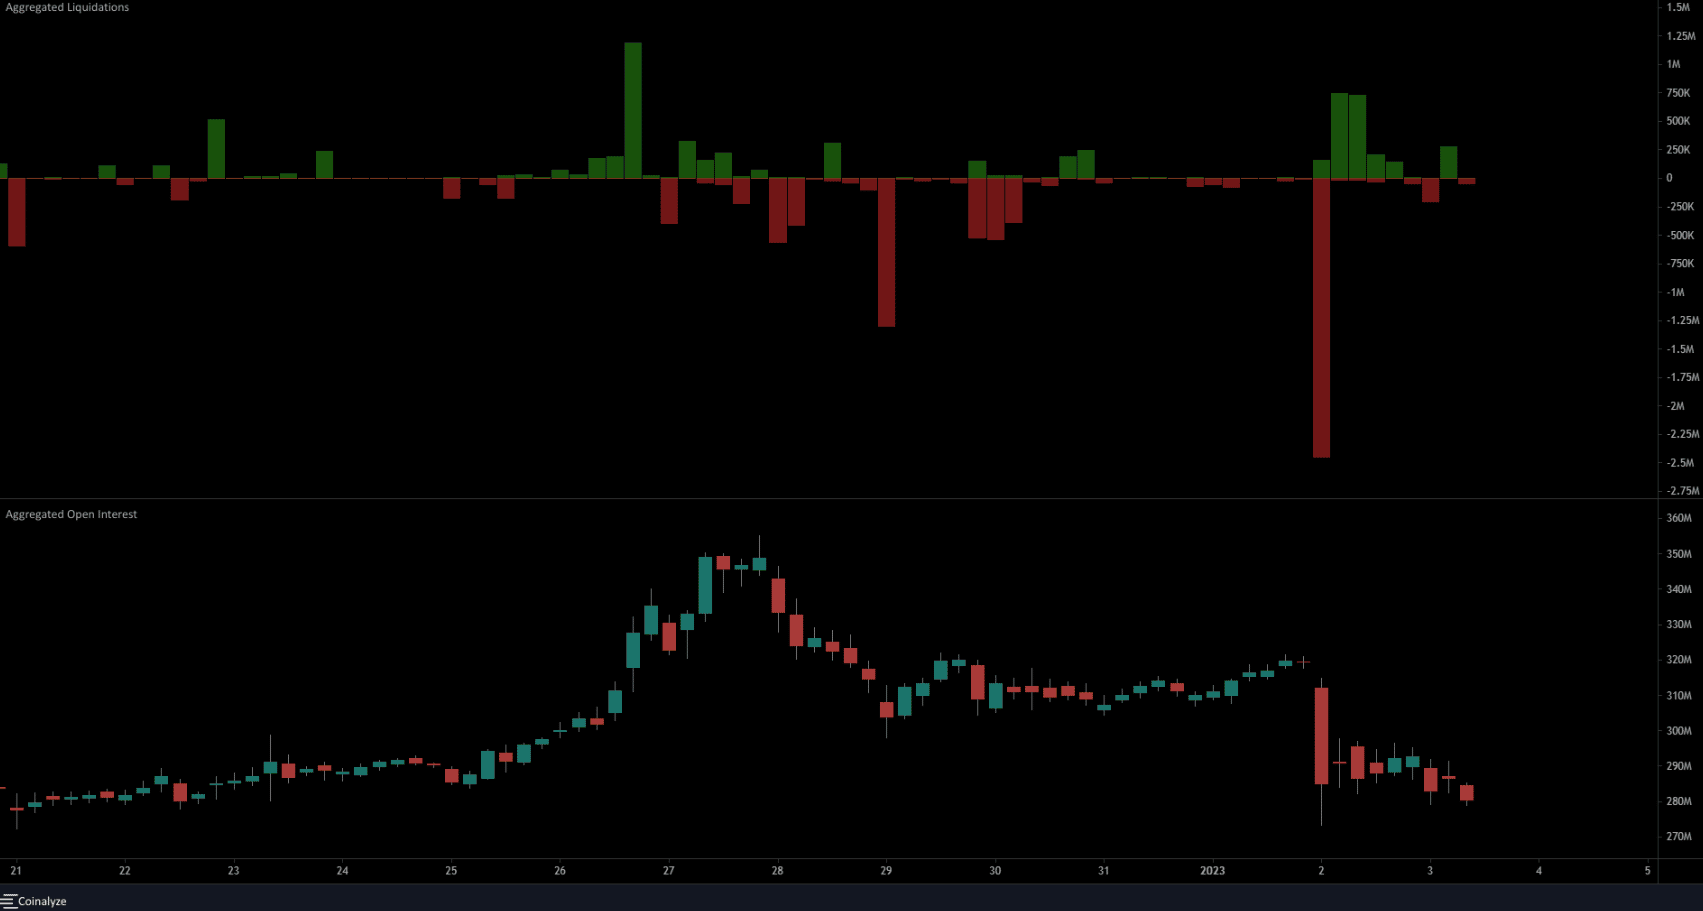
Over the past couple of days, XRP saw a violent move downward which was quickly reversed. This could have been a hunt for liquidity before a strong move upward. Hence, the bears must temper their enthusiasm.
Coinalyze data showed $2.4 million worth of long positions liquidated within a single hour on 2 January, when the price dropped to $0.3 before bouncing quickly back to $0.353 a mere 14 hours later.
The Open Interest charts showed a significant decline in OI, indicative of discouraged or liquidated long positions. This highlighted bearish sentiment. The price and OI need to stabilize for some time before bulls can expect a move upward.