XRP set to drop beneath yet another support level as $0.25 beckons

Disclaimer: The findings of the following analysis are the sole opinions of the writer and should not be considered investment advice.
In March 2021, the $0.42-$0.45 area acted like a band of demand from which XRP rocketed upwards, reaching as high as $1.96 in April. However, the price has set a series of lower highs since then, although it did have multiple bullish phases on the lower timeframes. At the time of writing, the $0.4-$0.45 area is a zone of supply for XRP and a stronghold of the bears. The bulls appeared quite weak in the markets, and another move downwards could materialize over the next few weeks.
XRP- 1 Day Chart
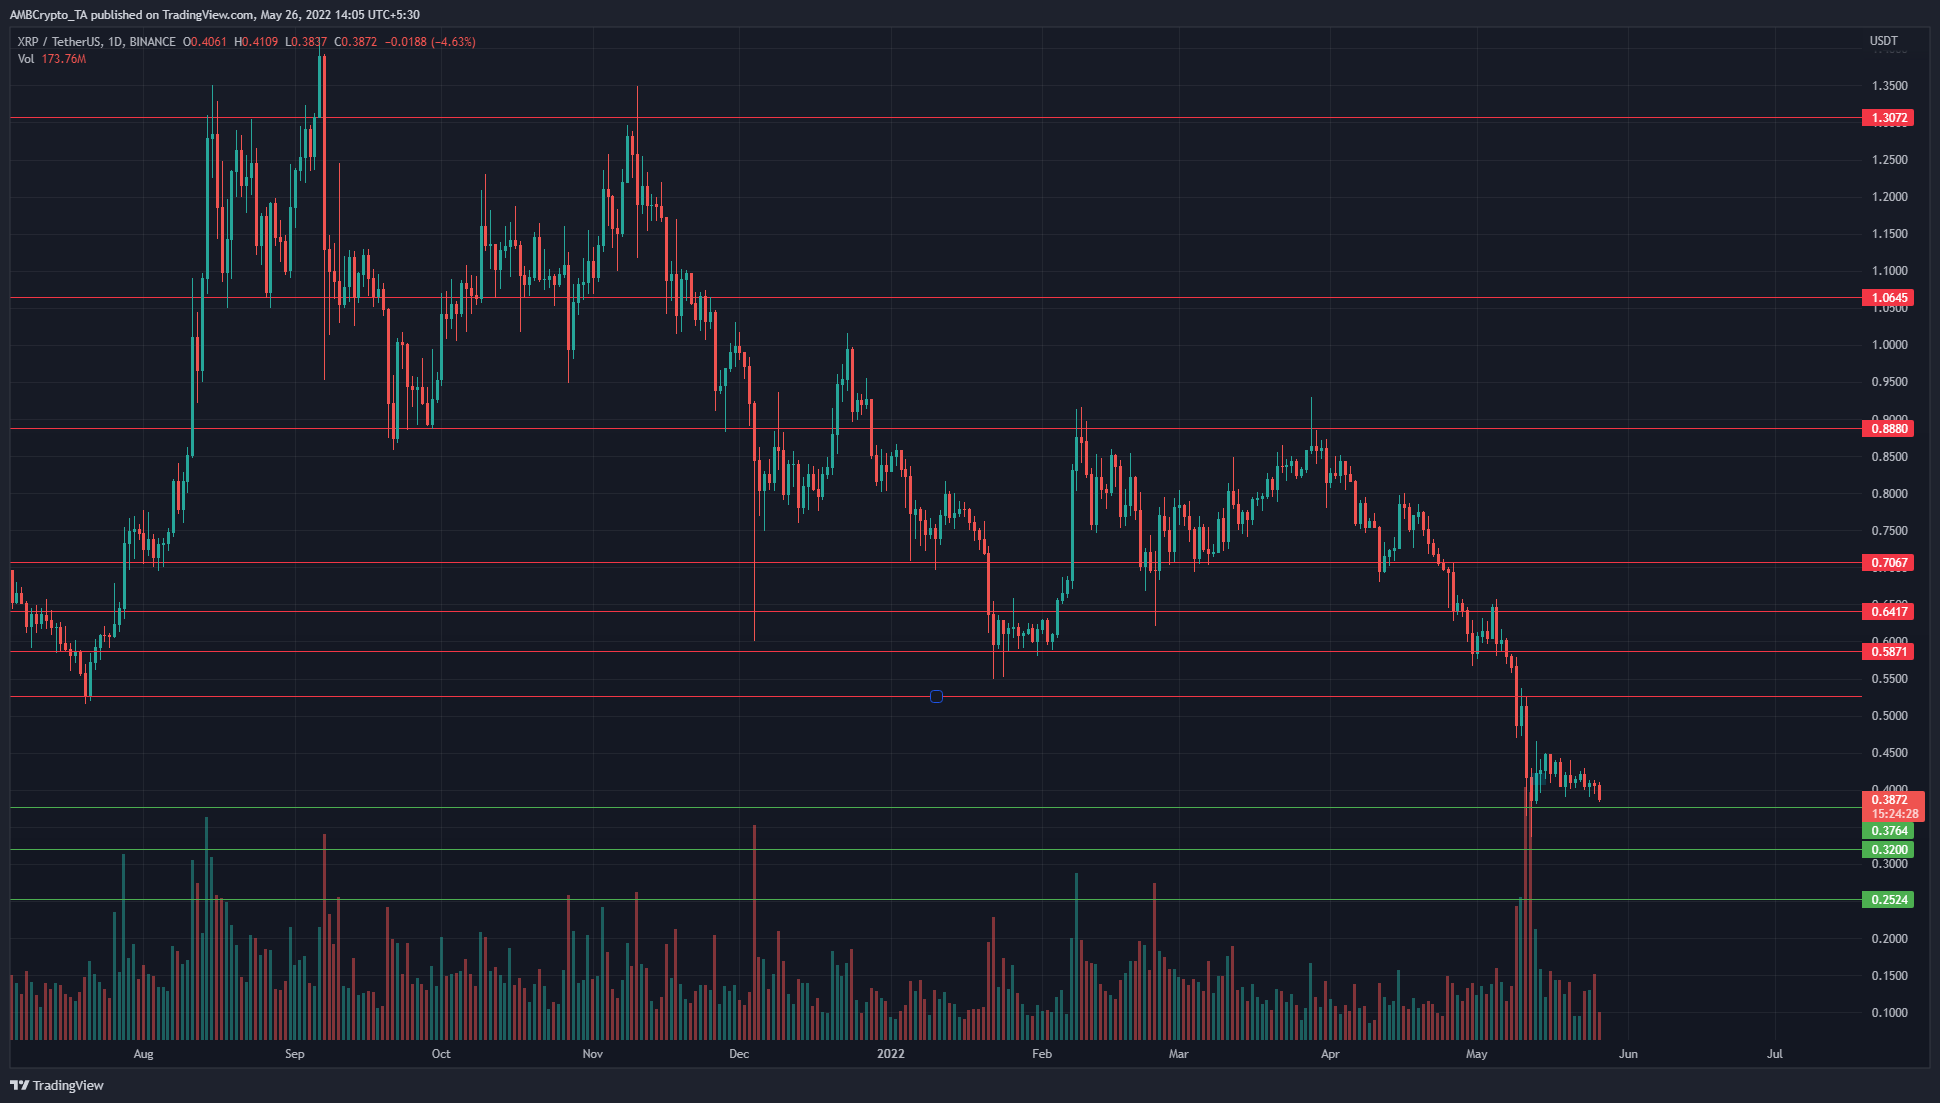
The structure of XRP on the charts is strongly bearish. It has set a series of lower highs since last September, and the price has not managed to close a daily trading session above any of the swing highs that represent the lower highs of the downtrend.
In early February and late March, there were strong rallies from the $0.58 and $0.7 support levels respectively. However, neither was able to break above the $0.88 resistance level, as the sellers were too strong in that area.
Earlier in May, XRP dropped from the $0.64 level and went as far south as the $0.32 support level, and at the time of writing the $0.387 level could be tested as support once more.
Rationale
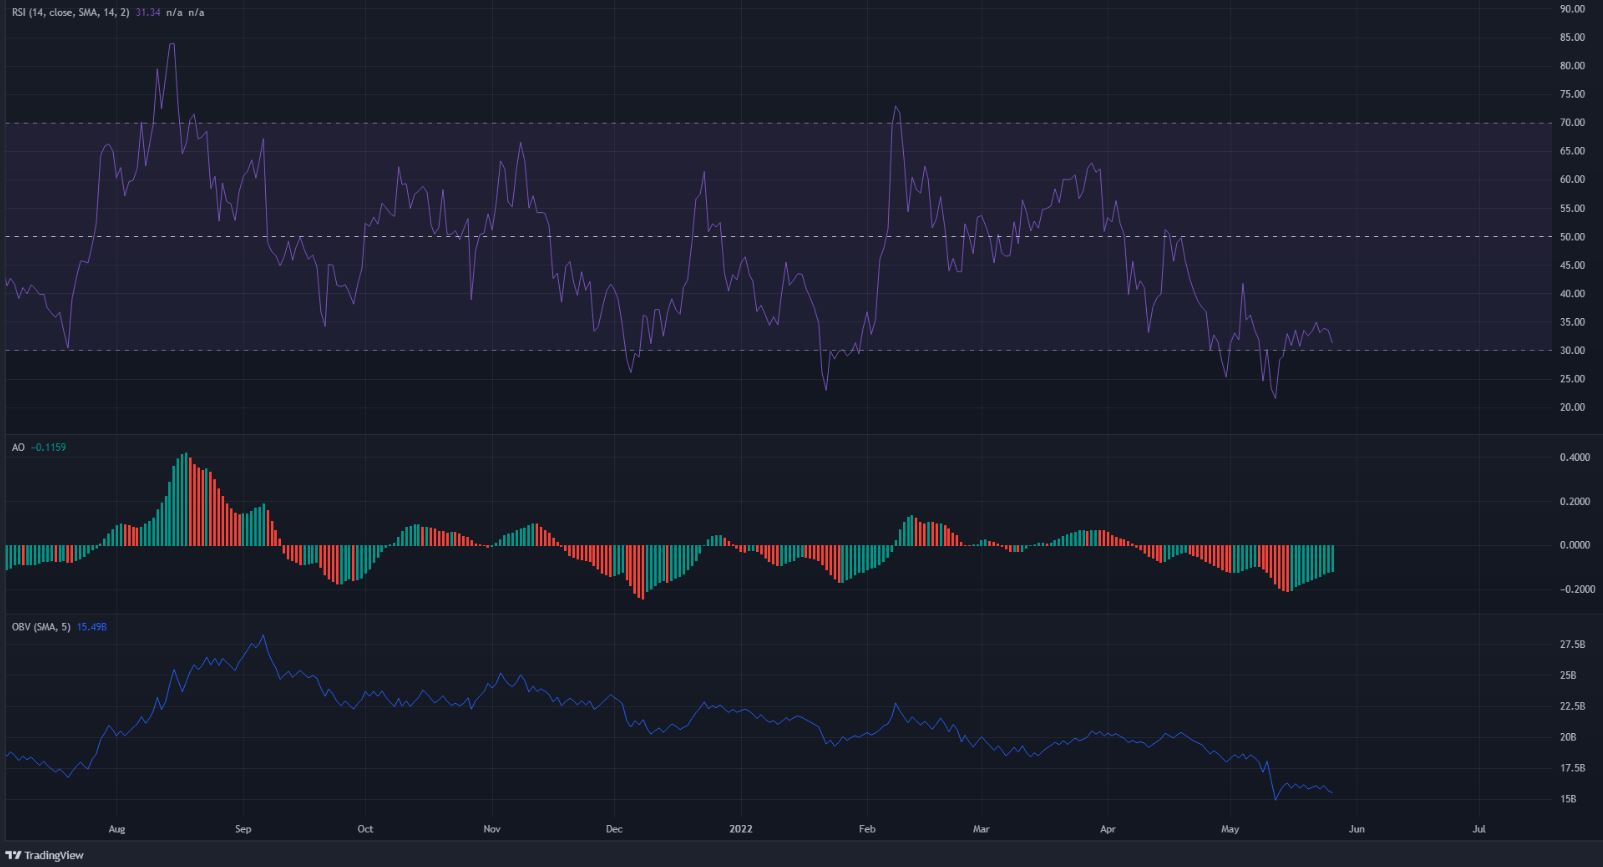
The RSI has been below the neutral 50 line since April, to denote a bearish trend in progress. At press time, the RSI was at 31.3 to show strong bearish momentum. The Awesome Oscillator was also below the zero line to show bearish momentum. However, the AO was forming green bears to indicate a pullback. This could shift in the next couple of days, especially if the price drops beneath $0.38.
The OBV has also been in decline, to show the lack of strong demand even as XRP continuously shed value on the charts. Therefore, further losses remain likely for XRP.
Conclusion
If the price does drop below $0.38, it could exhibit bullish divergence with momentum. However, the downtrend would not be reversed. Rather, a retest of the $0.38-$0.4 resistance zone in the next few days can be used to enter short positions targeting $0.32 and $0.25 over the next month.


