XRP, Solana, ETC Price Analysis: 30 January

The Crypto Fear and Greed index saw a 9 point surge over the last two days. Consequently, XRP pictured a slight bullish edge but still struggled to gather enough volumes. Besides, Solana and Ethereum Classic formed bearish patterns while their 4-hour RSIs flashed weakening signs.
Buyers need to step in to subdue the bearish tendencies of these cryptos.
XRP
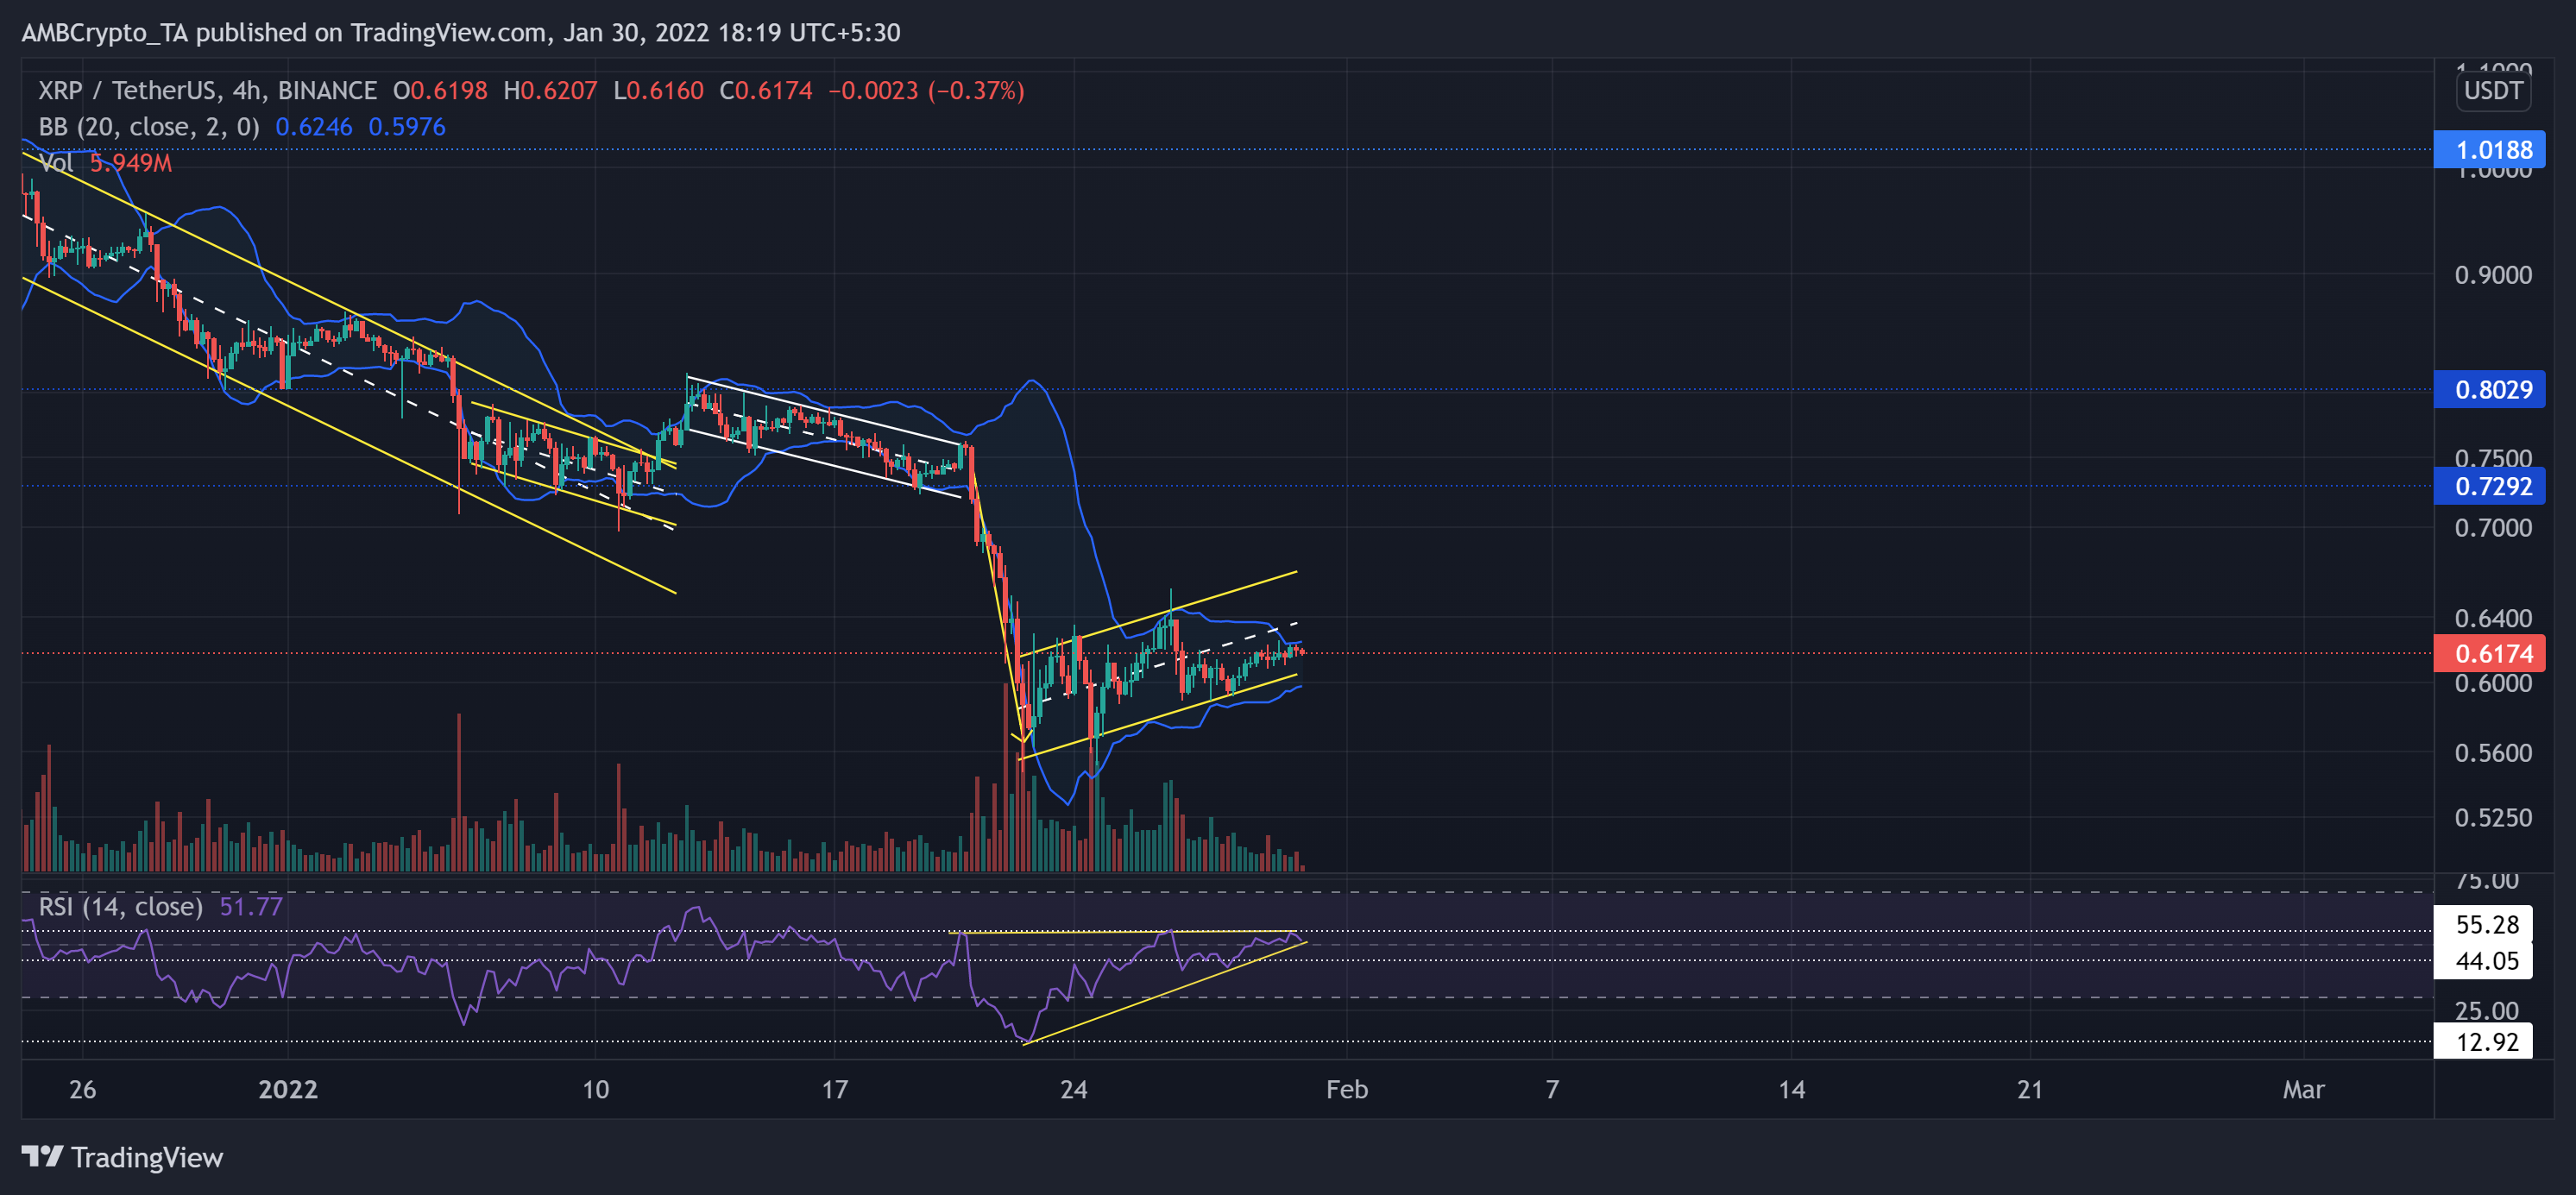
Since the sellers stepped in the $0.8029-level, the alt has been on a steady descent. Then, it formed a descending channel (white) on its 4-hour chart that transposed into a bearish flag.
After breaking out of the previous down-channel (yellow), XRP sharply plunged by 32.6% (from 12 January) to touch its six-month low on 22 January. Now, the upper band of the Bollinger bands stood as an immediate barrier for the bulls.
At press time, XRP was trading at $0.6174. The RSI and price seemed to correlate for the most part. After hitting its 13-month low, it steadily marked higher troughs while maintaining a flatter upper trendline at the 55-mark. This movement revealed a bullish edge, but it still needs to close above its resistance to confirm a strong rally.
Solana (SOL)
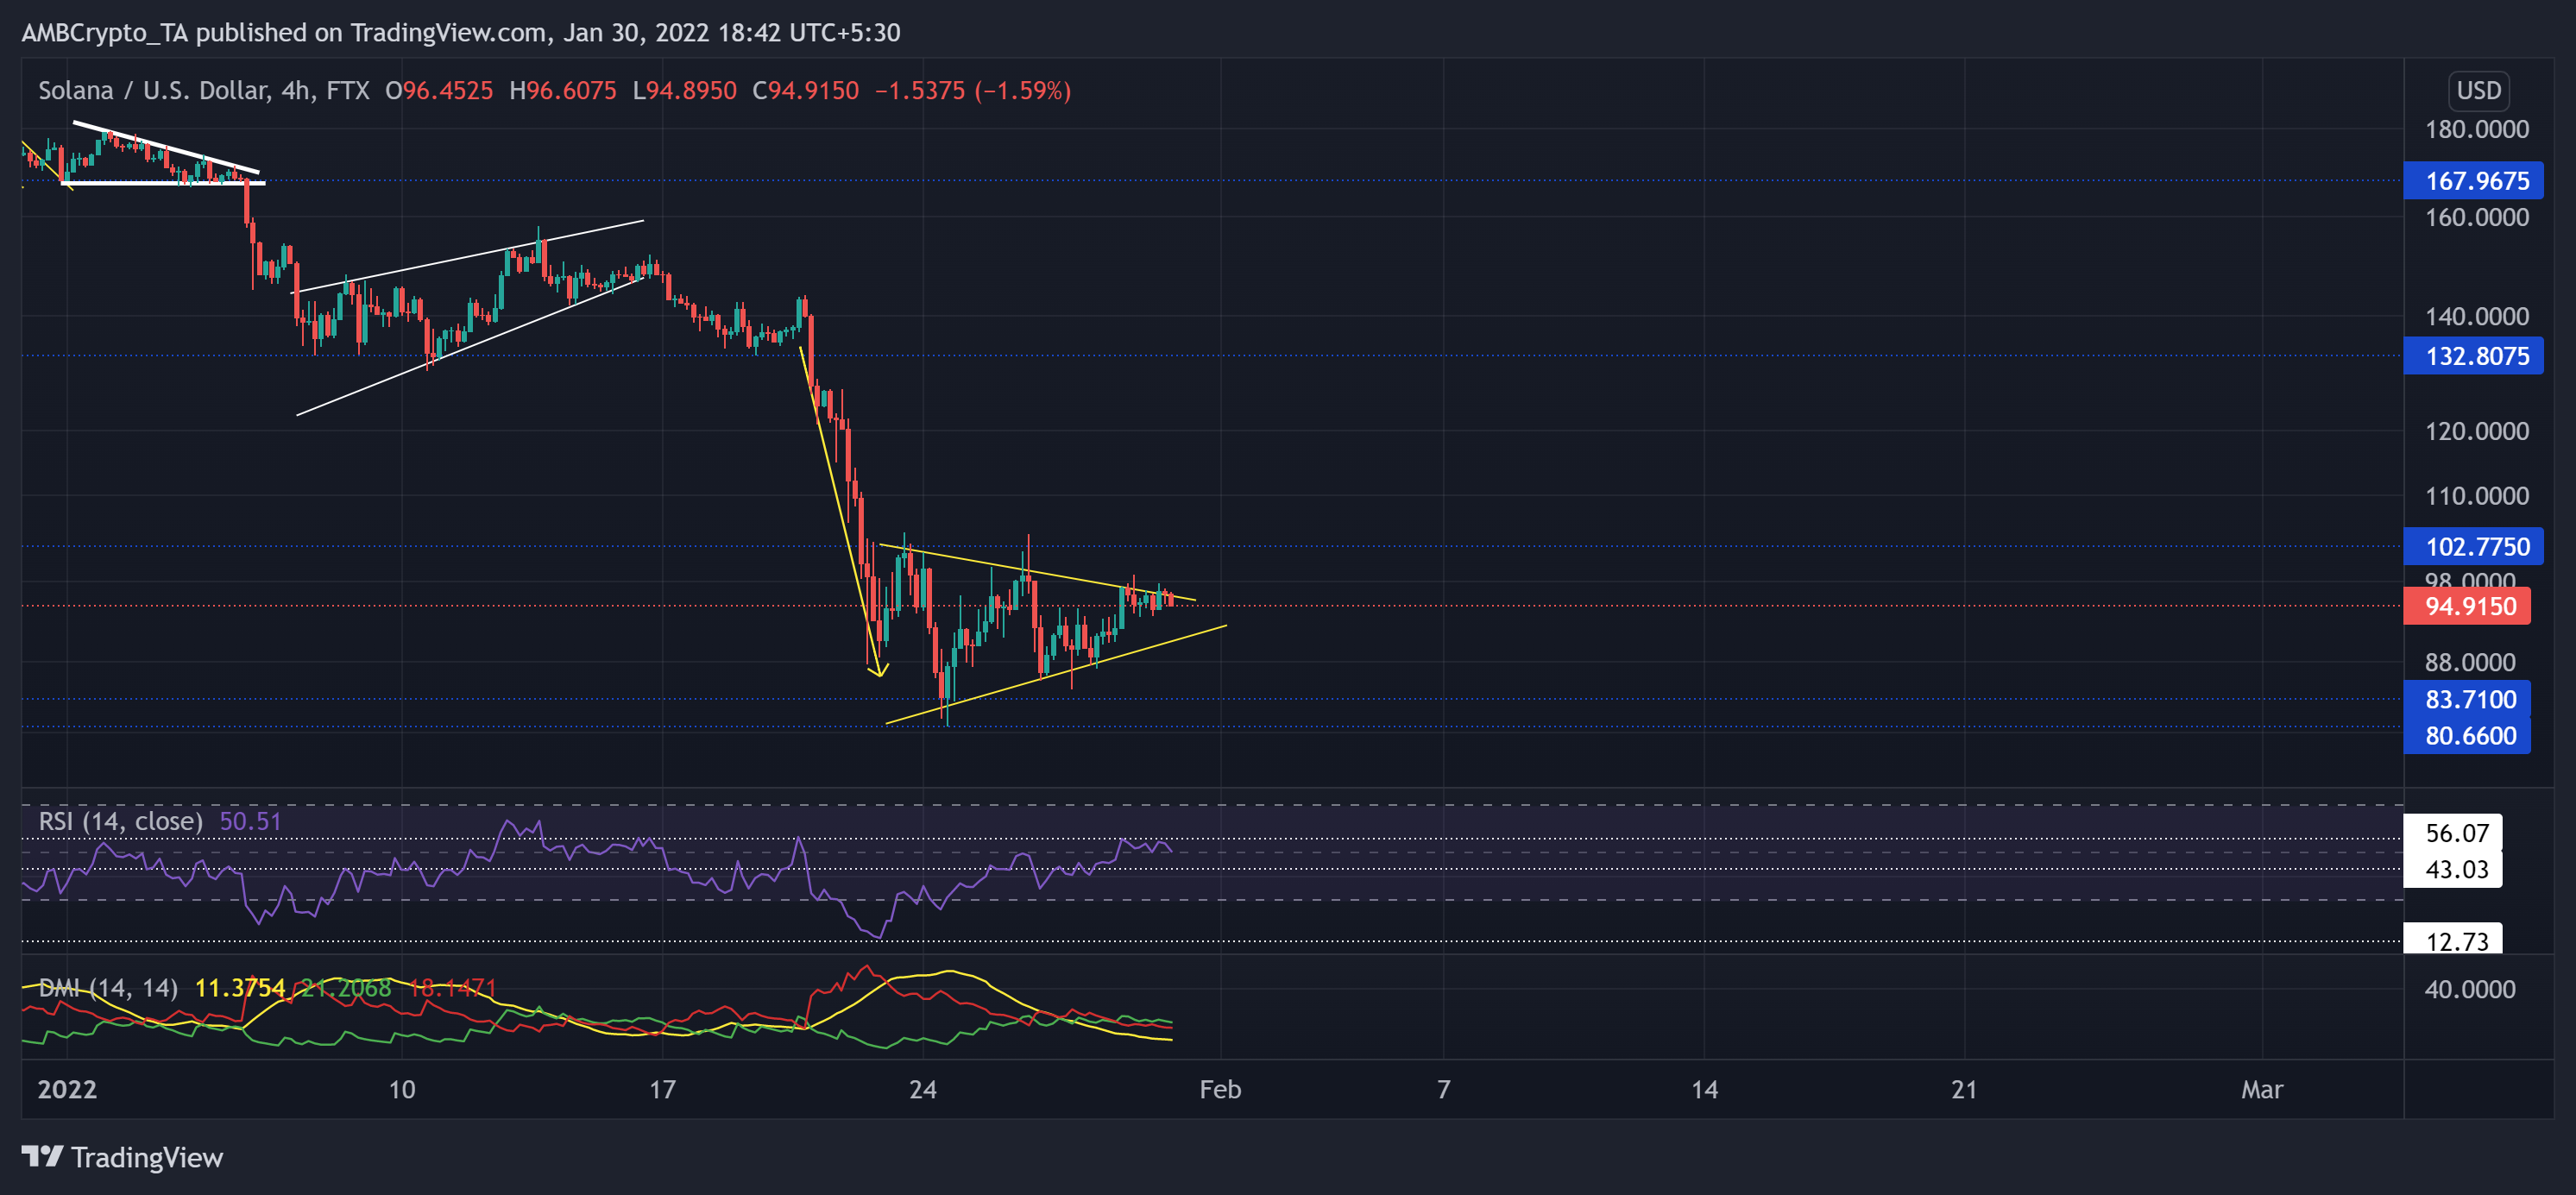
Losing the $132-mark was menacing for SOL’s bulls while the bears kept exerting sustained pressure. On top of it, the recent sell-off led to the alt losing 43.79% of its value (from 21 January). As a result, it marched toward its five-month low on 24 January.
Over the past few days, SOL has flashed a bearish pennant on its 4-hour chart. From here on, any pullbacks would find support at the lower trendline of the pennant.
At press time, the altcoin traded at $94.915. After plunging to its record low, the RSI upturned by 37 points from the oversold territory. But it still faced a strong hurdle at the 56-mark. Although +DI and -DI lines undertook a bullish crossover, the ADX stood weak. This reading entailed a wobbly directional trend for SOL.
Ethereum Classic (ETC)
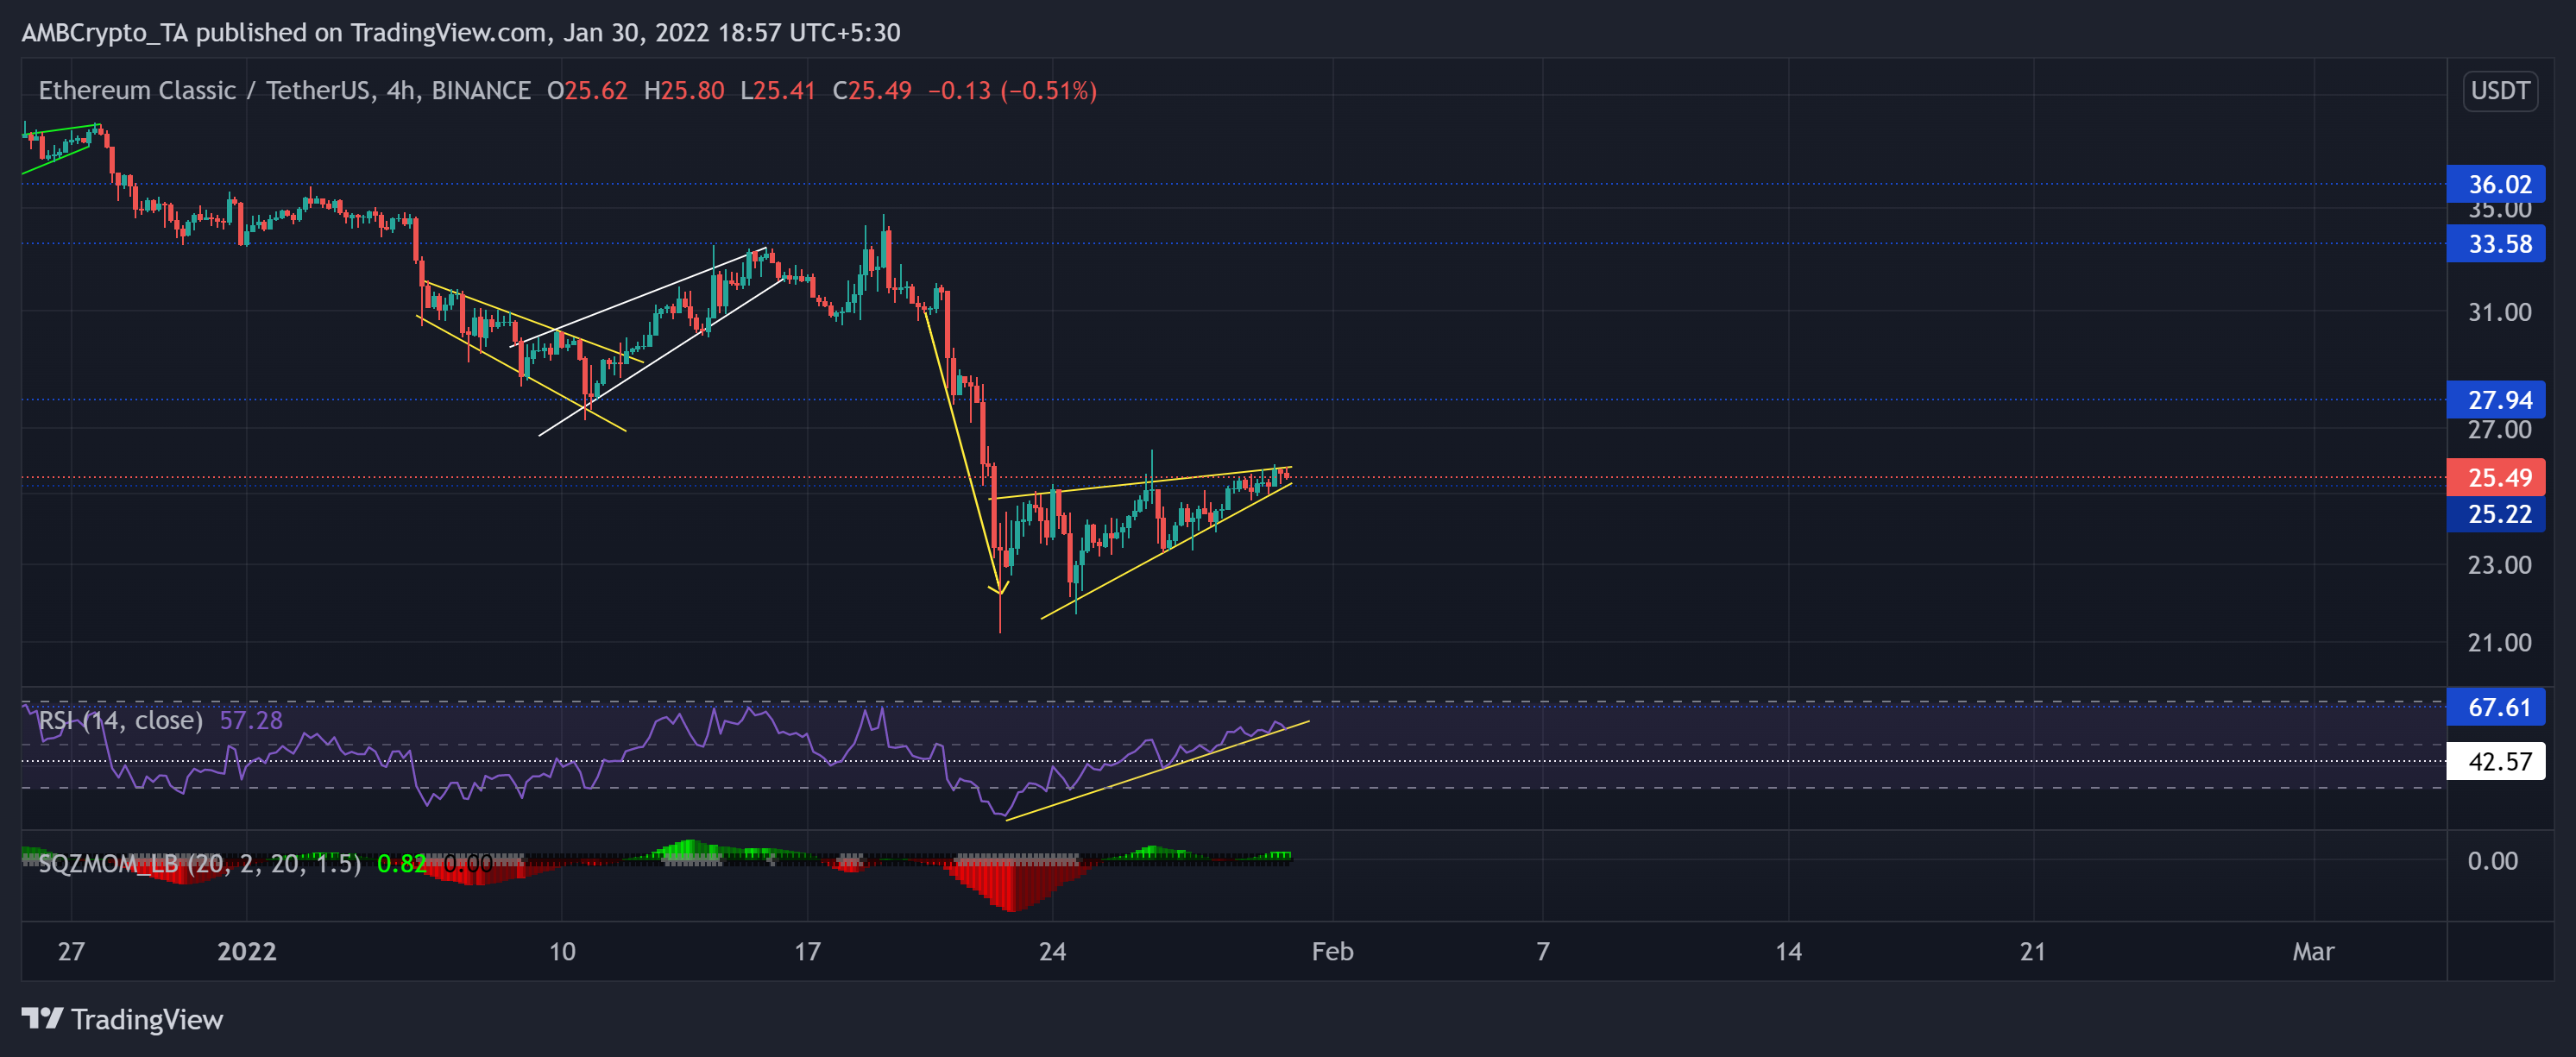
After losing the $36-$33.5 oscillation range, the bears have ensured to push the resistance from $33.58 to the $27.94-mark. As the sell-off phase initiated, ETC lost 39.98% (from 19 January high) until it hit its nine-month low on 22 January.
The alt formed a bearish rising wedge on its 4-hour chart over the last few days. Now, the testing point for the bulls stood at the upper trendline of the wedge.
At press time, ETC traded at $25.49. The RSI finally rose above the midline. Any fall below its trendline support (yellow) would propel a bearish edge. Further, the Squeeze Momentum Indicator continually flashed black dots, reiterating a low volatility phase. If the buyers fail to step in, the sellers could initiate a further sell-off and transpose into a high volatility phase.