XRP, Tezos, Decentraland Price Analysis: 05 December

After an early December recovery window, the bears halted the bullish momentum and altered the trend in their favor. As a result, XRP and Tezos continue to flash slackening signs as they hit their monthly lows on 3 December.
MANA finally ended its upswing after an up-channel breakdown over the last week.
XRP
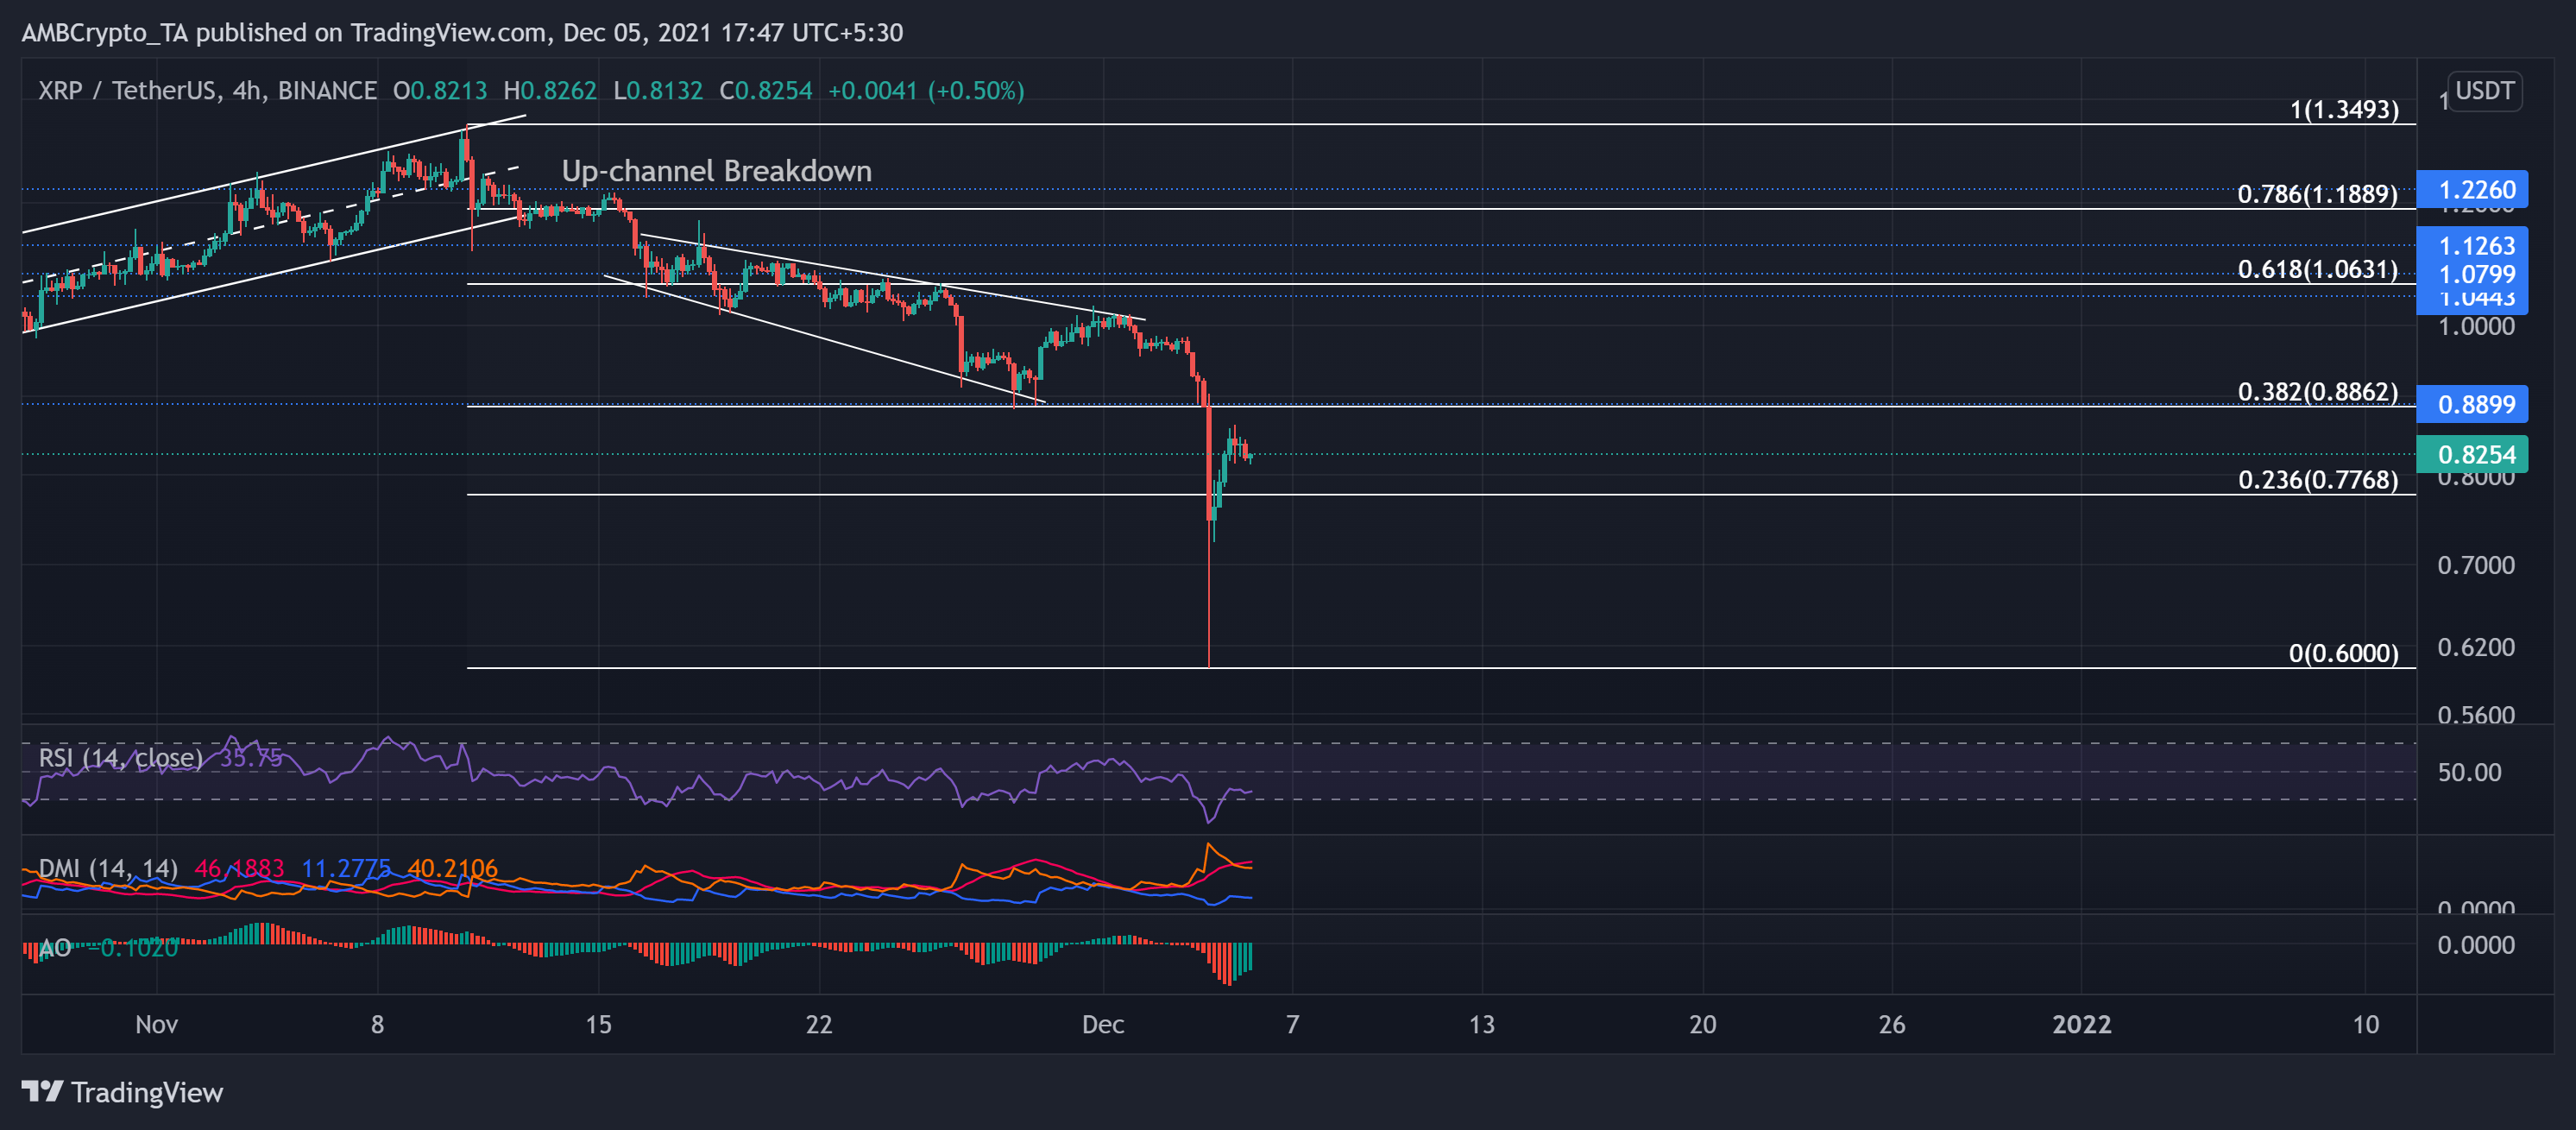
After striking its two-month high on 10 November, XRP resonated with the market dominaters by steadily declining since then. Post an up-channel breakdown, XRP price action marked a falling broadening wedge. Since then, the bulls retested the upper trendline multiple times but failed to propel an upswing.
As the price fell below the golden 61.8% Fibonacci level, a further breakdown occurred below the 16-week long resistance and the 38.2% Fibonacci level at the $0.88-mark.
XRP lost more than half of its value since 10 November. Accordingly, it touched its four-month low on 3 December. Since the bulls ensured the $0.6-support, the alt saw traded at $0.8254 after noting a 6.9% 24-hour gain.
The RSI practically struggled to reach the 40-mark over the past day. It stood near the oversold region. Also, the DMI hinted at a continuing bearish influence in the near term.
Tezos (XTZ)
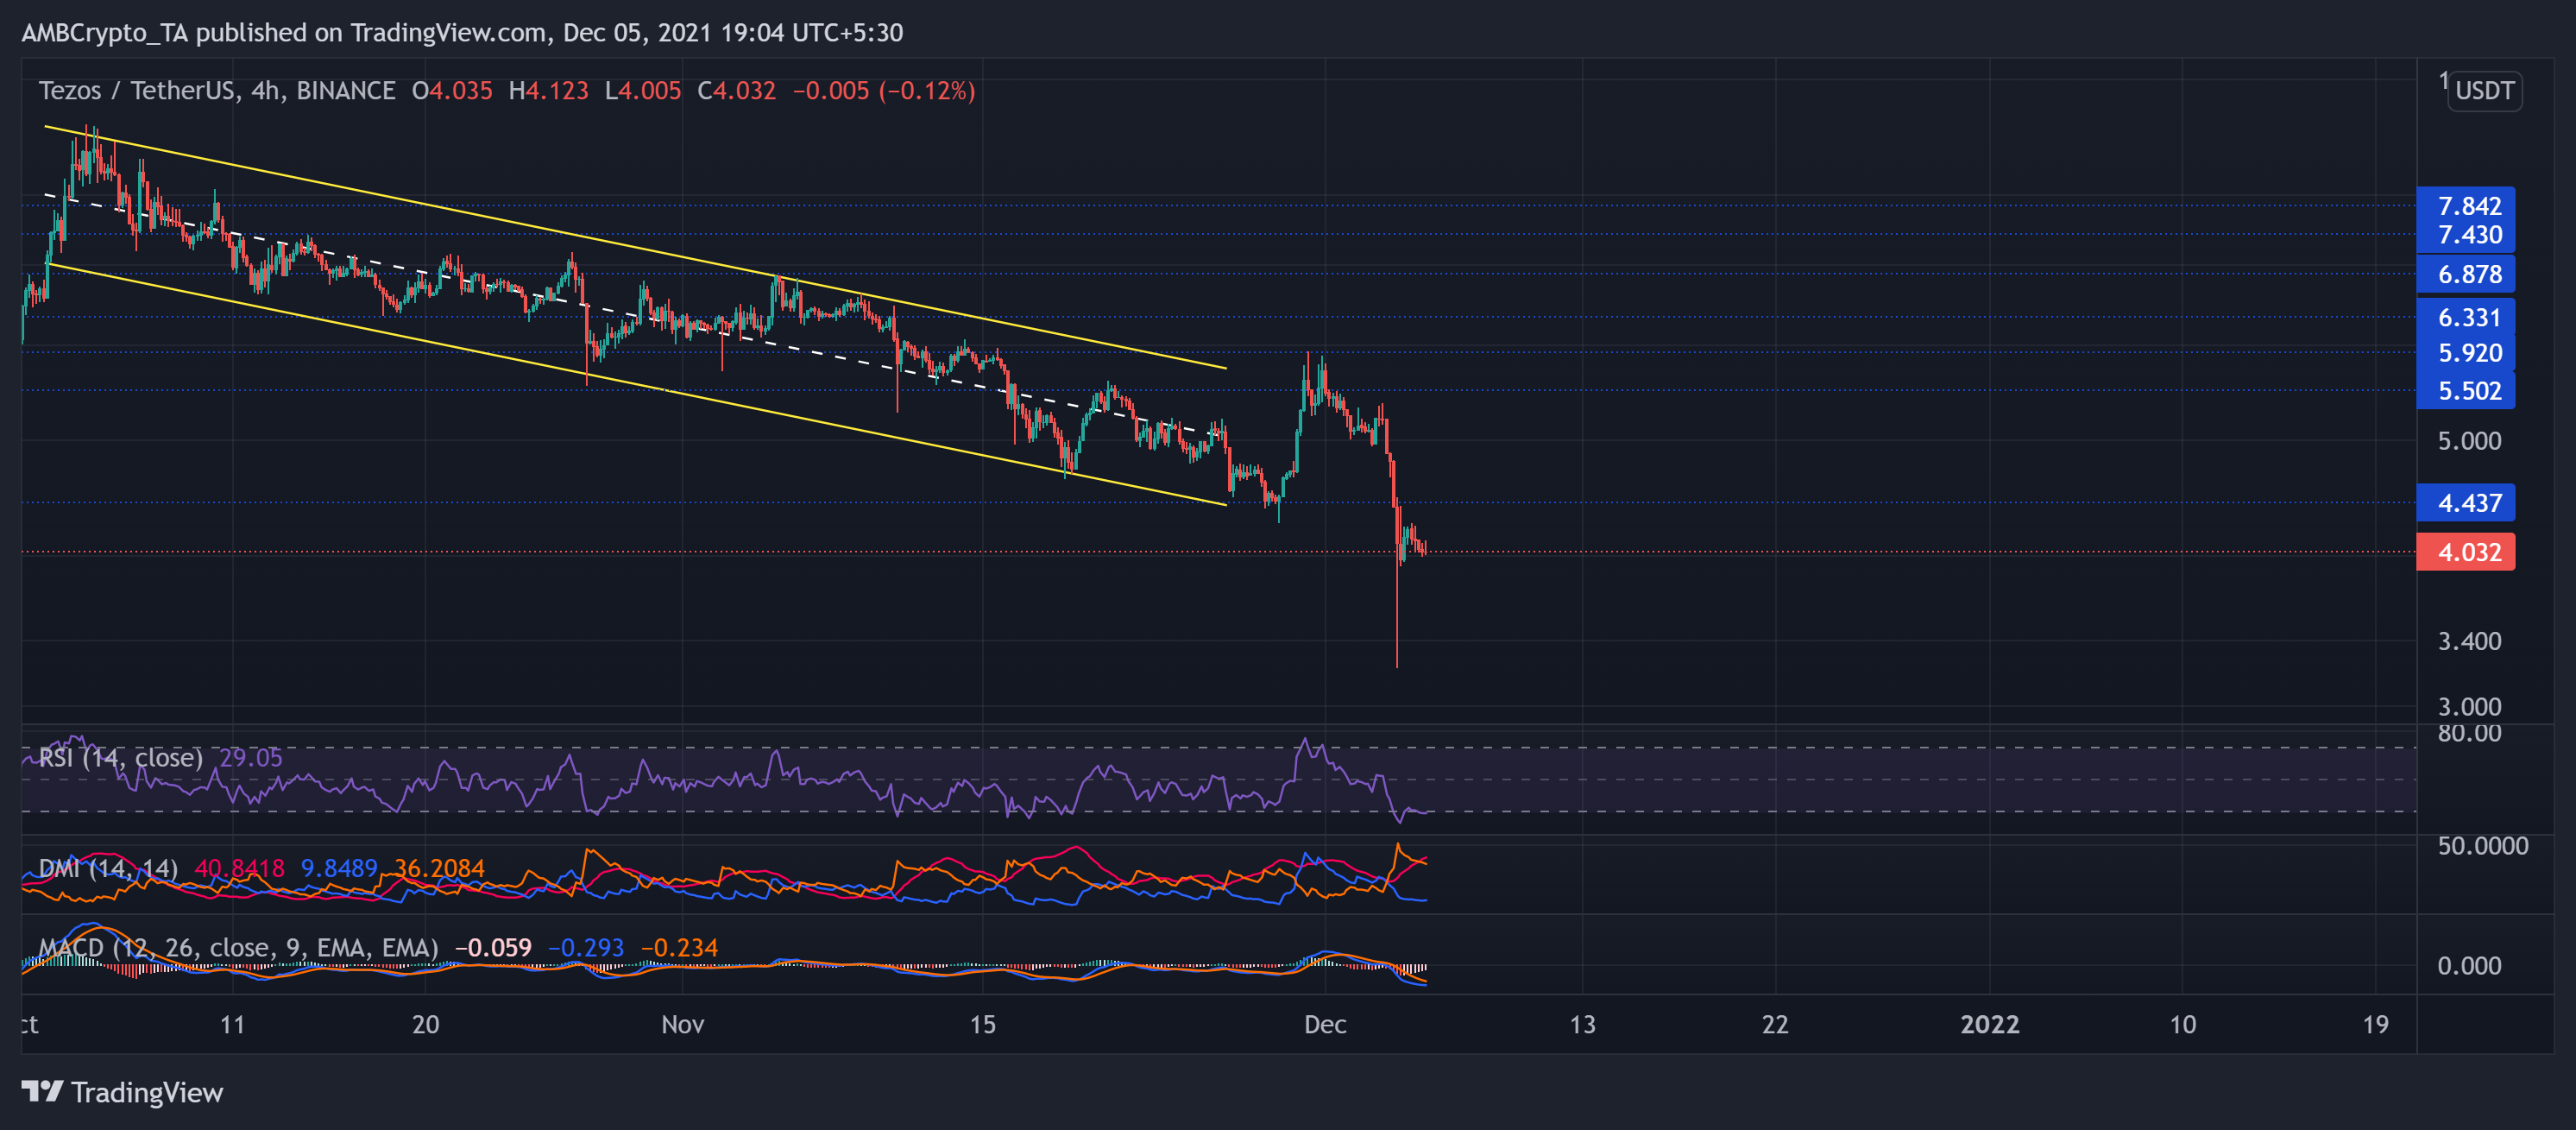
XTZ was on a constant downfall after striking its ATH on 4 October. The price diligently withdrew as it moved along the descending channel. Then, even after an over 30% down-channel breakout on 29 November, the bulls failed to sustain their edge as the price could not breach the three-week resistance at the $5.92-mark.
The bulls needed to sustain the three-month resistance at the $4.4-mark. But they failed to uphold that level causing a further breakdown toward its 15-week low at $3.226.
At press time, XTZ traded at $4.032. The RSI stood extremely weak in the oversold region. Unless the bulls can gather momentum with high trading volumes, the bears have ensured a strong immediate resistance at $4.4. Also, the DMI undeniably preferred the bears with a high directional trend. The MACD confirmed the bearish trend as both the lines were below the equilibrium.
Decentraland (MANA)

During the spring phase for the metaverse tokens, MANA propelled to its ATH on 25 November. After a descending wedge breakout, the price action transposed into an ascending channel.
However, since then, the bears retested the $4.9-mark resistance thrice before a significant slump. This decline led to an up-channel breakdown for the first time in 23 days. The downturn finally correlated with the market trend, unlike its previous rallies. However, at press time, the alt traded at $3.82 after noting a 13.9% 24-hour gain.
After dipping into the oversold territory, the RSI showed some revival signs. However, it could not cross the half-line. Further, the DMI resonated with the RSI by displaying a bearish bias. But the AO projected a near-term bullish comeback.


