Analysis

XRP traders can bank on this long-term bearish structure and “buy the dip”
Posted:
| Last updated: January 30th, 2024
Journalist

Disclaimer: The findings of the following analysis are the sole opinions of the writer and should not be considered investment advice.
XRP did not have a very interesting time on the price charts in the last few days. Its momentum has been rather flat for the most part. Lower timeframe traders could profit from level-to-level trading of XRP, and at the time of writing it sat just above the $0.333 LTF support.
An analysis of a higher timeframe revealed that not a lot was different. The momentum was still neutral and leant bearish, while neither the buyers nor the sellers were dominant.
XRP- 1-Day Chart
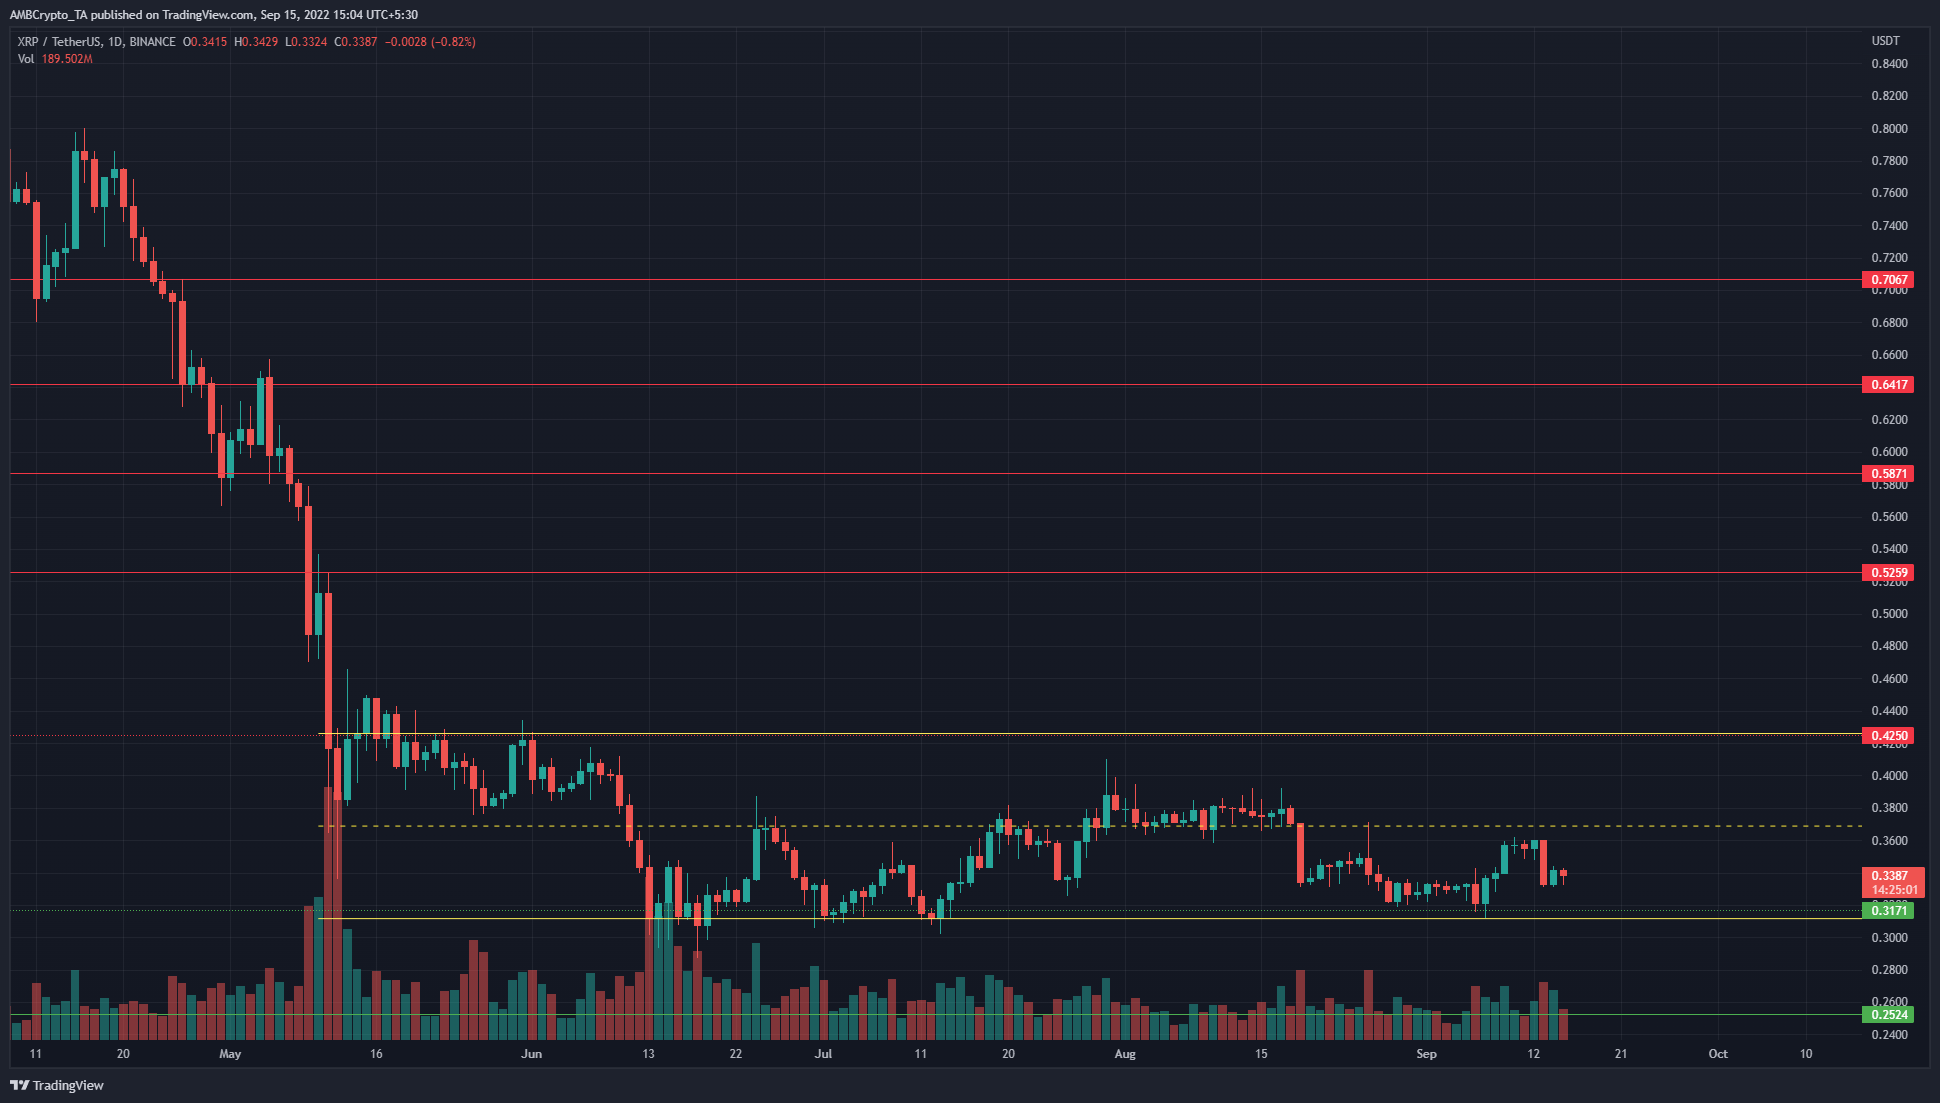
Source: XRP/USDT on TradingView
In yellow was marked a range within which XRP has traded from May. The range highs and lows lie at $0.425 and $0.31, with the mid-point at $0.37. The fact that the mid-point of the range has been respected as support and resistance multiple times highlights its significance.
The zone of demand to watch out for, naturally, was the range lows. A horizontal support level at $0.317 was also quite significant, and has been since August 2018. Similarly, the $0.42 resistance level (range highs) has also acted as support in May 2018.
The longer-term plan for XRP could be as simple as trade the range. A revisit of the range lows would offer a buying opportunity, with a stop-loss below $0.3. The $0.37 and $0.42 levels can be used to take profit.
Rationale
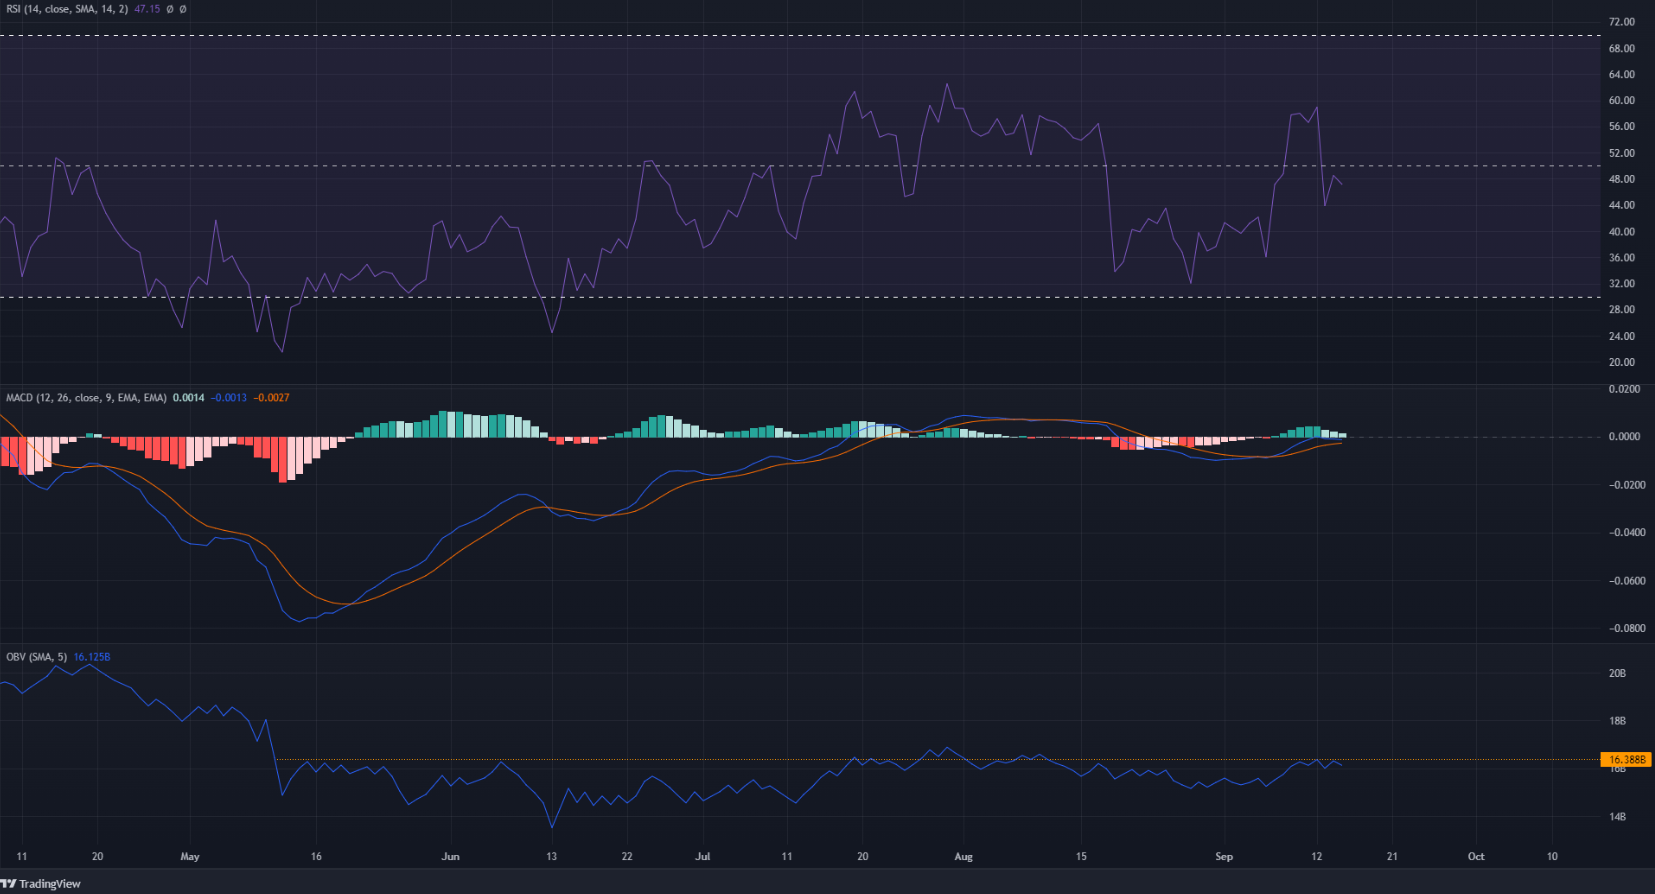
Source: XRP/USDT on TradingView
The daily Relative Strength Index (RSI) oscillated from 60 to 45 over the past few days. Previously, the RSI spend a good portion of August below the 40 mark to show strong bearish momentum. The Moving Average Convergence Divergence (MACD) was moving just below the zero line at the time of writing.
Together, the momentum indicators showed a slightly bearish bias. The On-Balance Volume (OBV) was also at a resistance area from May.
Conclusion
On the whole, both the price action and the indicators highlighted that XRP was indecisive. It was more likely to post losses over the next week or two than gains. The range can be used to look for lower timeframe buying opportunities behind XRP.