XRP traders should watch out for these levels in the coming week

XRP traders have a lot of cheer about with regard to its latest price action. The alt registered a near 20% jump yesterday and reclaimed the $1-mark for the first time in 10 weeks. Will this jump act as a much needed catalyst for XRP to reclaim its May highs?
Only time will tell but the long-term outlook was certainly favorable. At the time of writing, XRP traded at $1.01, up by 12.8% over the last 24 hours.
XRP Daily Chart

Source: XRP/USD, TradingView
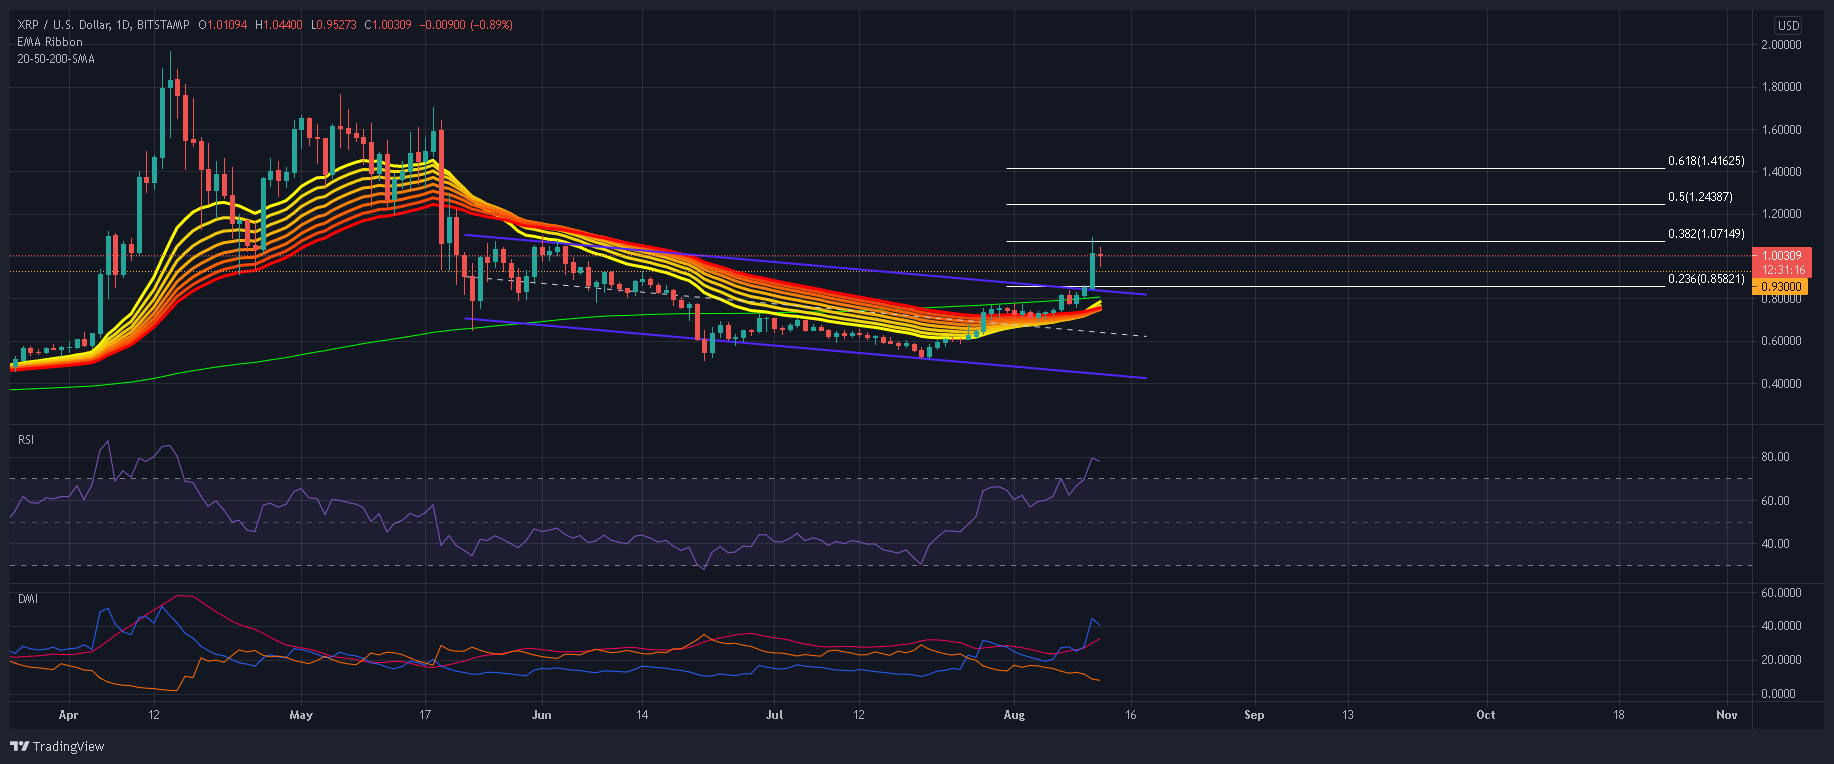
There were a lot of other bullish developments on XRP’s daily chart but first, let’s talk about its down-channel. The bearish pattern, which extended post XRP’s 62% decline in mid-May, was finally toppled after yesterday’s jump. Importantly, XRP also managed to successfully close above its 200-SMA (green)- an event that often functions as a buy signal.
Potential targets were plotted using the Fibonacci Tool and the 50% ($1.24) and 61.8% ($1.41) levels were now in the crosshair. In case of an immediate pullback, support levels rested at 5th April swing high of $0.93 and the 23.6% Fibonacci level at $0.858. However, a close below $0.80 would likely open the floodgates for an extended sell-off.
Reasoning
EMA Ribbons also marked a crucial milestone. The moving average lines, which had limited upside for XRP since June, noted a crossover after nearly 11 weeks. This indicated the onset of a bullish trend and more upside in the coming days. The DMI’s +DI line remained above the -DI and suggested that uptrend XRP’s was under no threat of losing steam. However, the RSI did trade in the overbought region- an area which usually triggers a sell-off. However, such a correction was healthy over the longer run.
Conclusion
There were plenty buy signals present for XRP after its price closed above the 200-SMA and its EMA Ribbons. The indicators also traded in bullish positions and additional hikes can be expected in the coming week. Pullbacks can be countered between $0.80-93, but a decline below $0.80 could sound warning bells in the market.


