Analysis

XRP, VeChain, and WAVES Price Analysis: 24 May
Posted:
| Last updated: January 30th, 2024
contributor

As Bitcoin glided near its high liquidity range in the four-hour timeframe for the last 12 days, the market abstained from high volatility. The broader sentiment still lurked around the ‘extreme fear’ zone.
Thus, the near-term technicals of XRP, VeChain, and WAVES hovered in the bearish-neutral zone. The buyers still needed to inject volumes to gain enough thrust for exiting the tight phase.
XRP
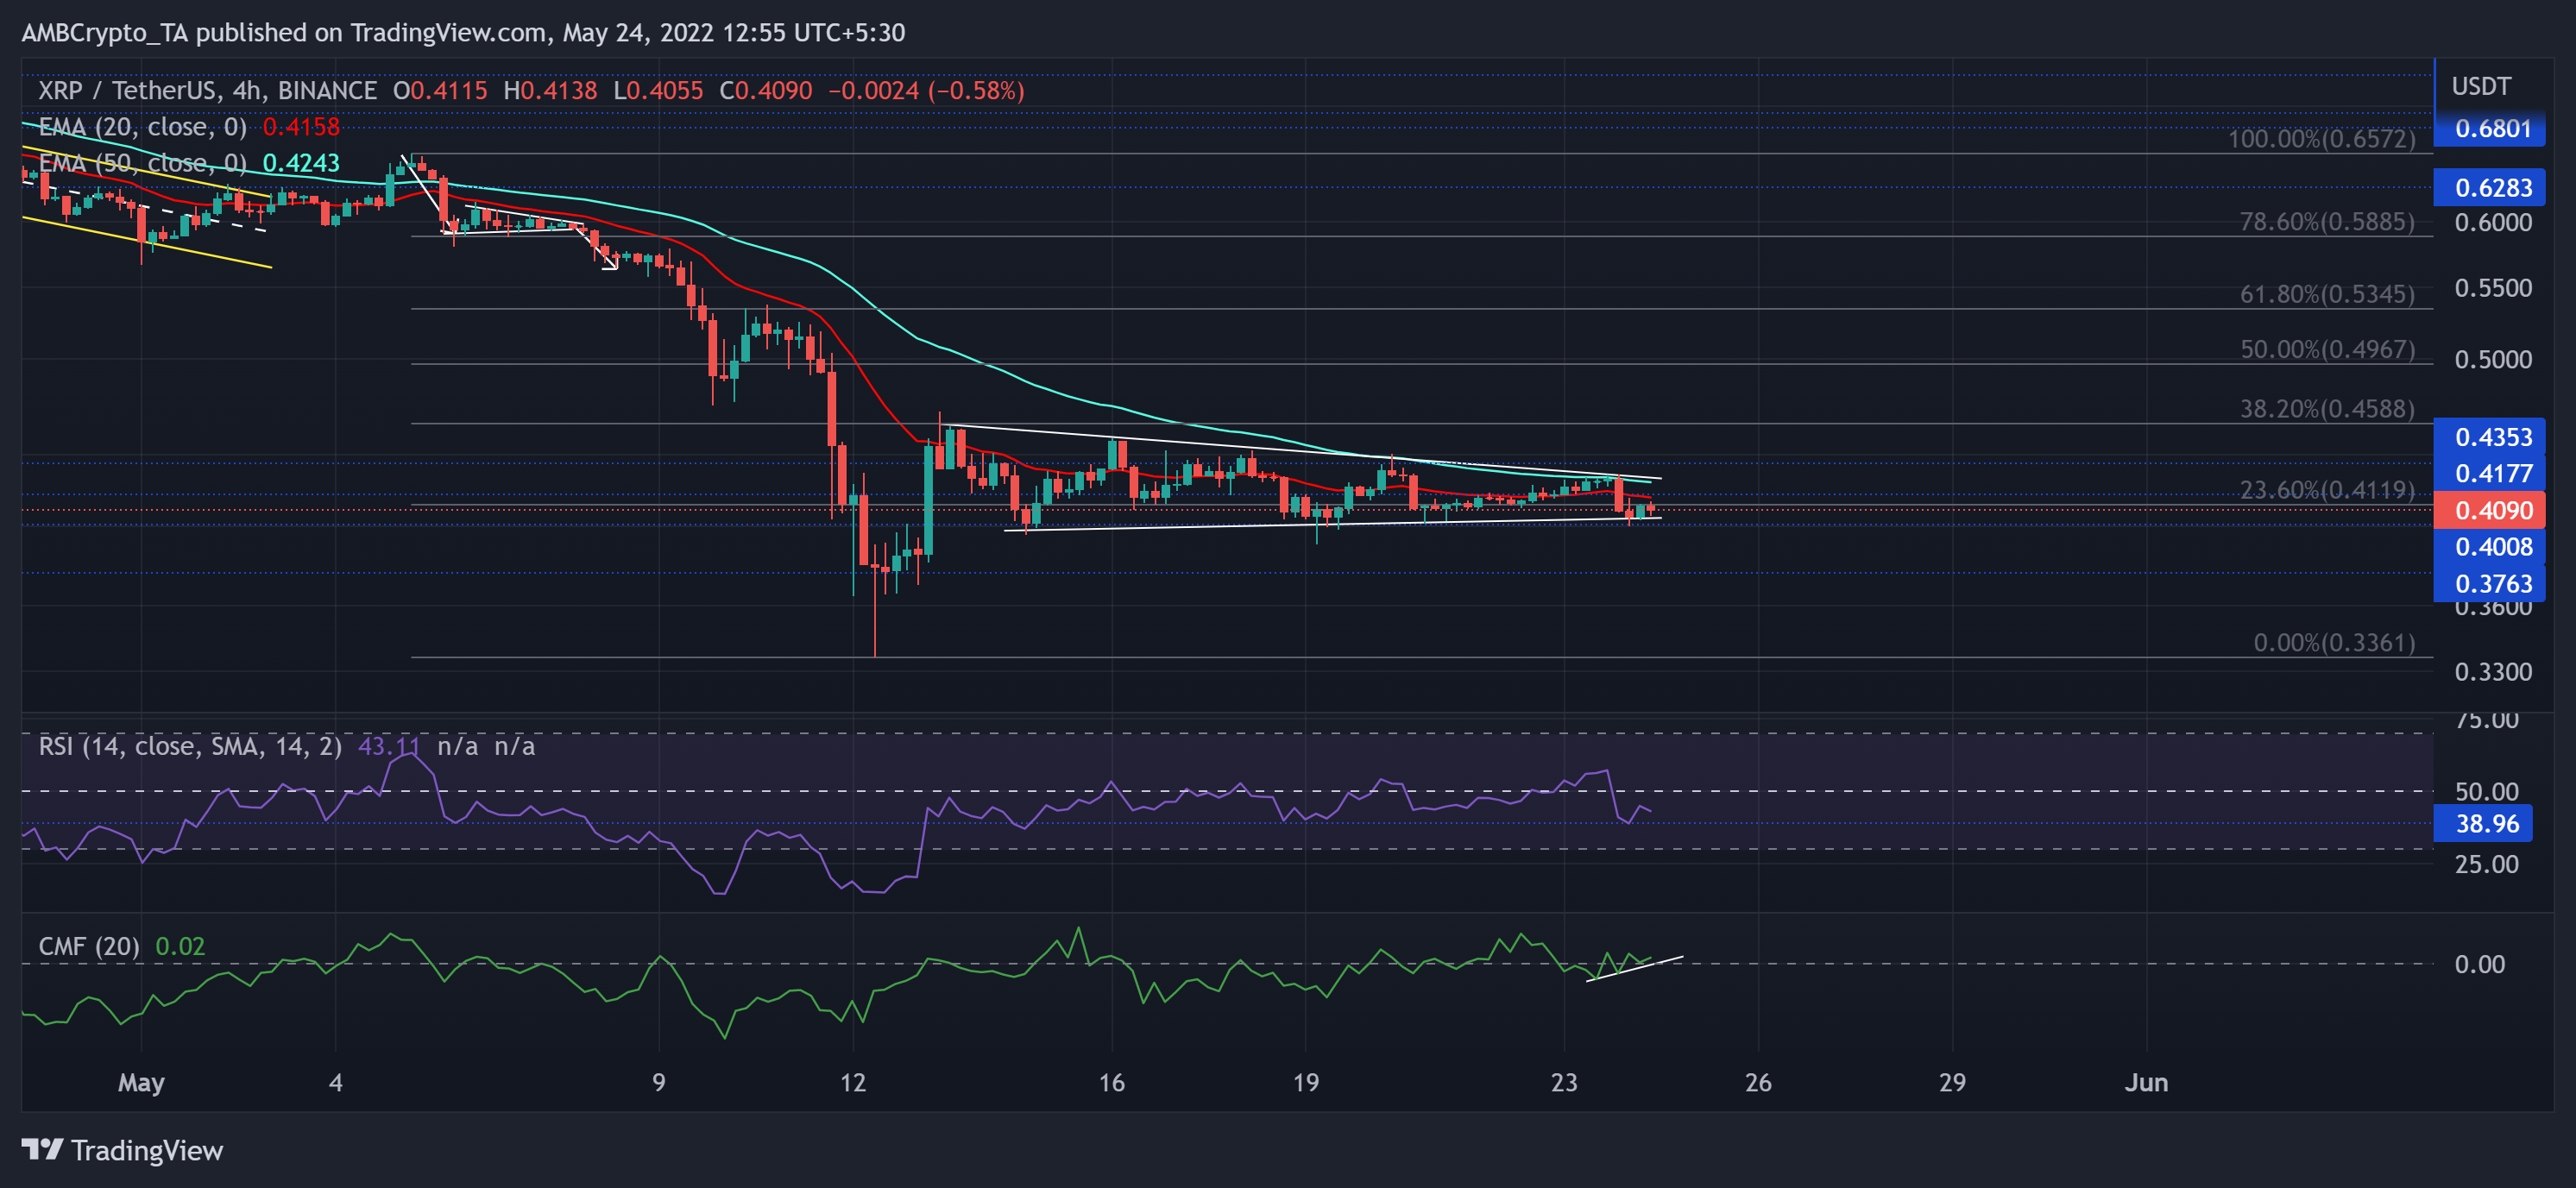
Source: TradingView, XRP/USDT
The downswing from the 61.8% Fibonacci resistance propelled an over 37% five-day plummet. As a result, XRP fell toward its 15-month low on 12 May. Further, the Point of Control (POC, red) short-lived the recent buying endeavors by leading XRP into an extended squeeze phase near the $0.42-zone.
As the 20 EMA (red) refrained from jumping above the 50 EMA(cyan), the bears still substantially controlled the near-term trend. A close above the 23.6% level would now position the alt to test the 50 EMA before breaking out from the symmetrical triangle.
At press time, XRP traded at $0.409. The Relative Strength Index (RSI) steeply dropped toward the 38-mark base in the past day. Nevertheless, the CMF undertook a bullish divergence with the price. Thus, keeping up the chances of the buyers breaching the 23.6% level.
VeChain (VET)

Source: TradingView, VET/USDT
In gearing up their efforts to amplify the selling pressure, the sellers provoked multiple rallies while keeping control of VET’s peaks for over a month. The altcoin lost over 73% (from 31 March) of its value and plunged toward its 15-month low on 12 May.
After consistent tries to find a spot above the EMA ribbons, buyers were able to finally test the $0.33-level above the ribbons. But the recent evening star candlesticks pulled VET below its 20 EMA yet again.
At press time, VET was trading at $0.03168. After dropping from the 67-mark, the RSI took a solid plunge that plateaued near its equilibrium. A strong close below this mark could lead to undesired short-term losses.
WAVES

Source: TradingView, WAVES/USD
WAVES rigorously fell since the beginning of April and pierced through critical price points. The altcoin lost over 91% of its value from 31 March and poked its 16-month low on 21 May.
While the $5.4-$5.6 range seemingly supported the recent retracements, WAVES bounced back and forth within the bounds of a down-channel (white). The Supertrend finally changed its position to depict a buying edge by turning green.
At press time, WAVES was trading at $5.66387. The RSI saw a bearish V-top and kept testing the 41-mark support for the last two days. Any fall below this level could hamper the near-term recovery prospects. On top of this, the ADX displayed a substantially weak directional trend for the alt.