XRP, Waves, Maker Price Analysis: 06 February

XRP retraced some of the huge gains it registered after its surge left the $0.3-level of previous resistance far behind. Waves highlighted an area of strong support, one that the market’s bears attempted to assimilate. Finally, Maker showed it was likely to retest $2,400 in the coming days.
XRP
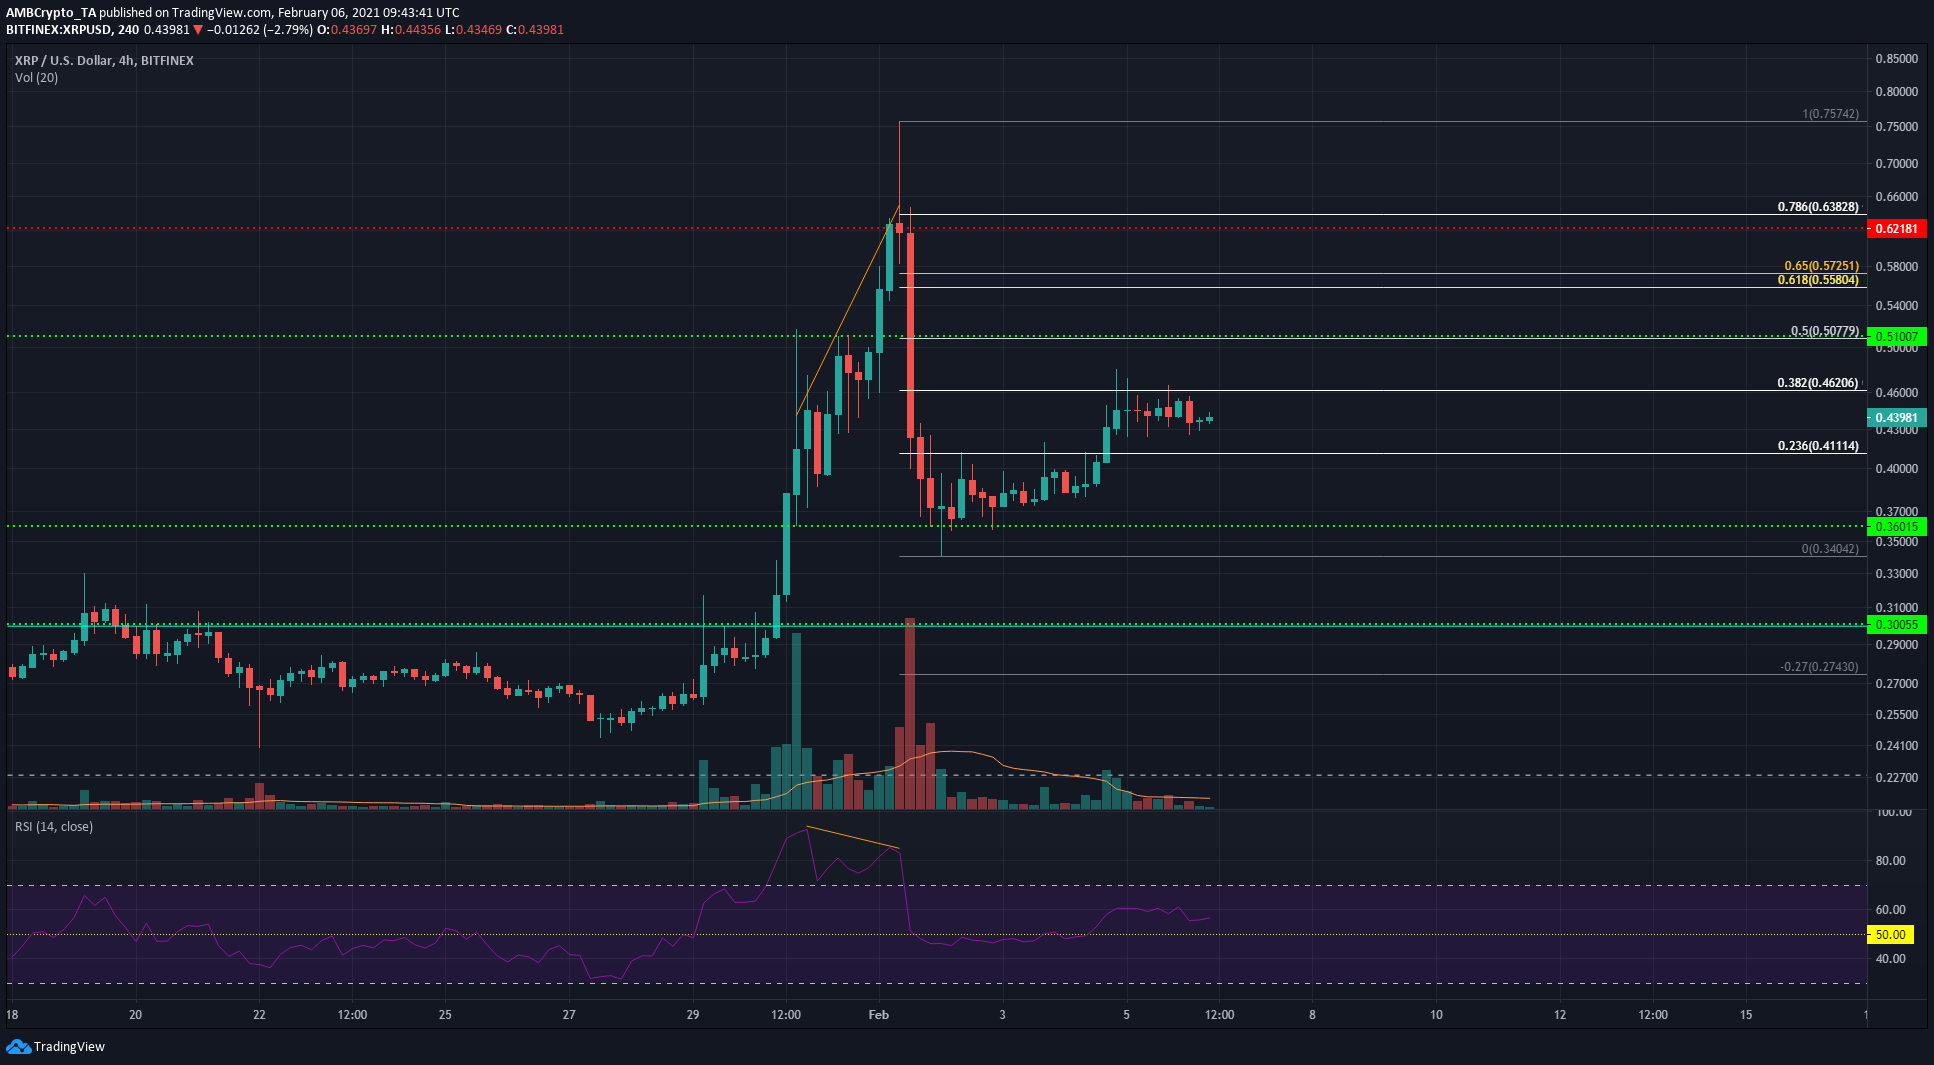
The attached chart is a good example of why a divergence can’t be traded alone. The RSI registered a lower high even as the price surged, but the bearish divergence provided neither an upper ceiling nor a timing to enter a short trade.
An indecisive candle in the vicinity of the $0.62-region was needed to signal that the bullish momentum in the market had been replaced. Thereafter, XRP slid by nearly 40% the same day.
Since then, XRP’s price has consolidated just under the 38.2% retracement level of the aforementioned drop. The trading volume has also been low over the past few trading sessions. The $0.46-resistance is unlikely to be broken on the back of such low volumes.
Waves [WAVES]
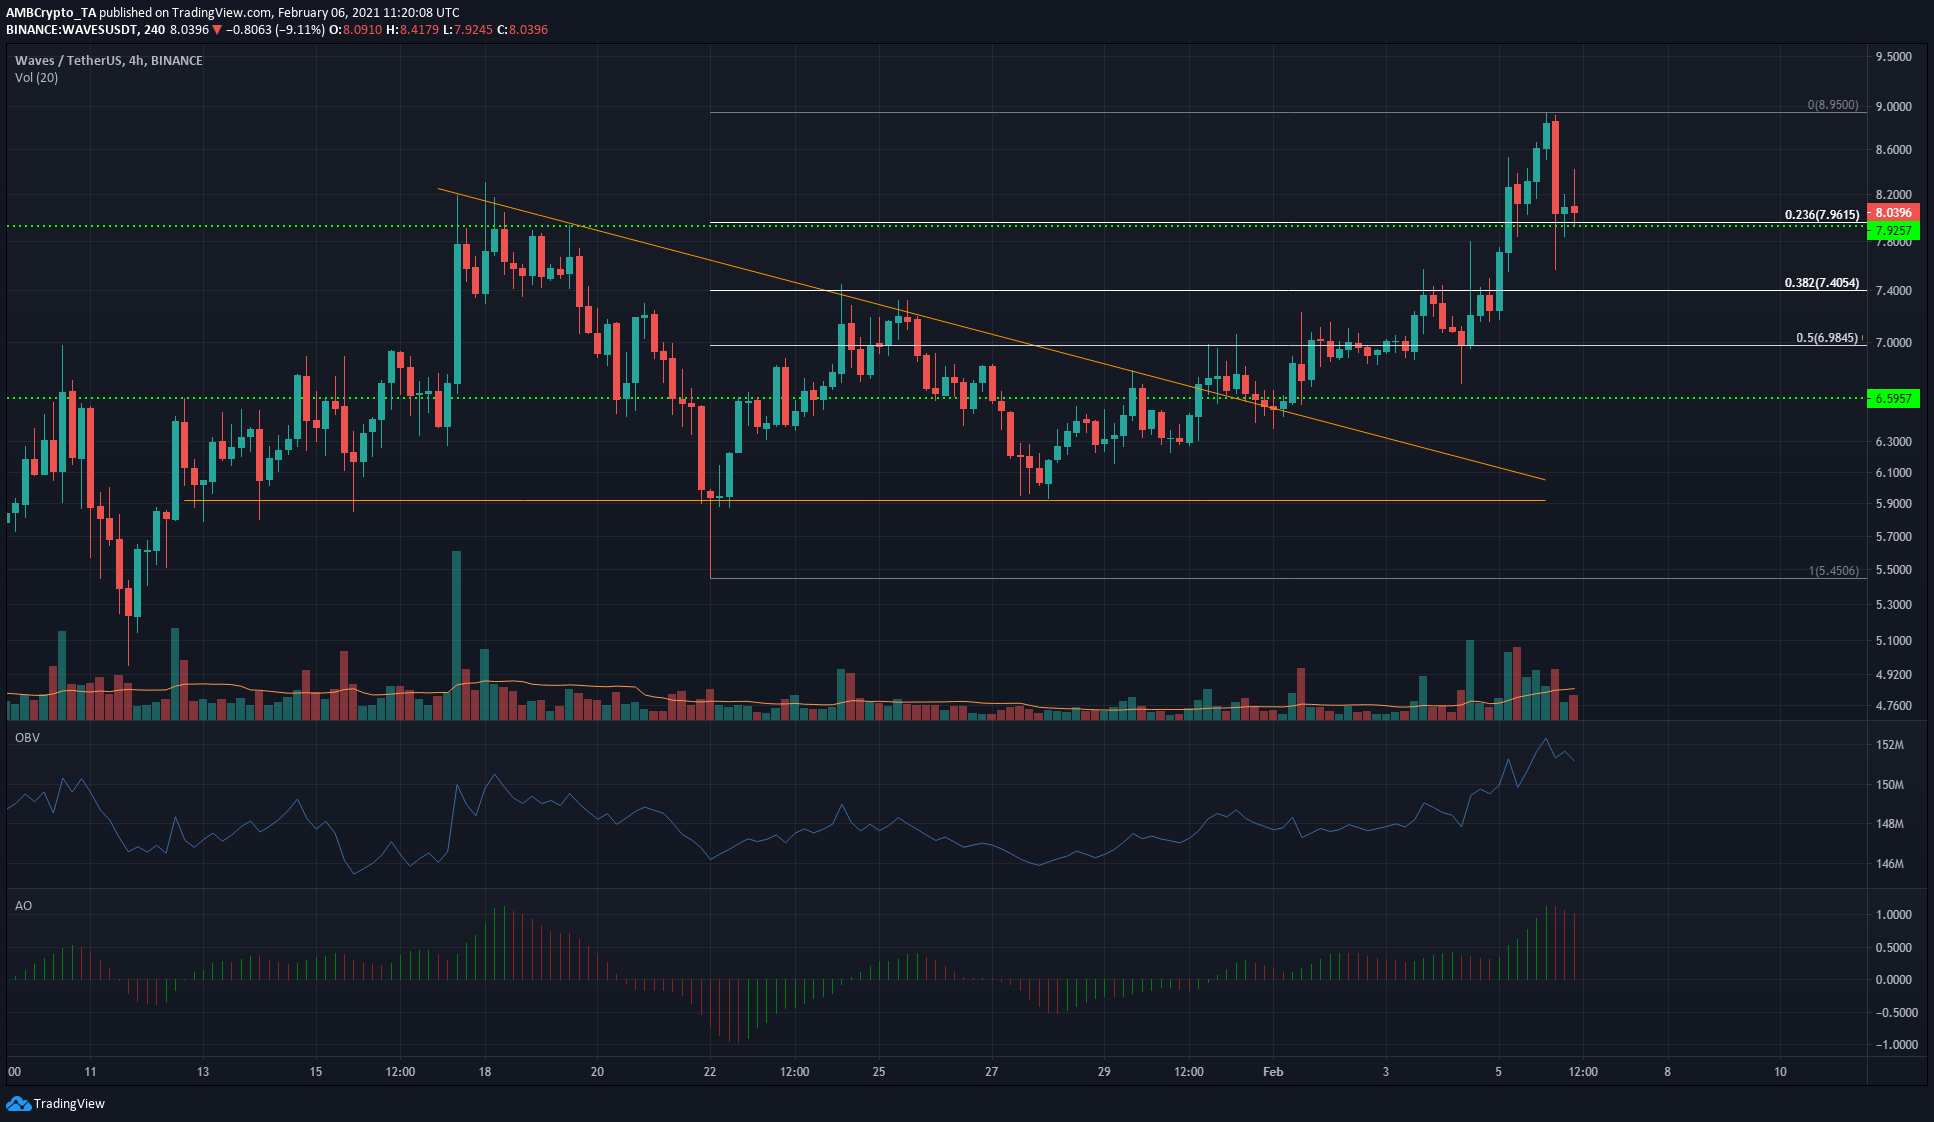
After gently trending lower since early December, the OBV reversed its trend and underlined buyer dominance in WAVES’ market once more. The price also made a bullish market structure and broke out to the upside of a descending triangle (orange) a week ago.
Using the Fibonacci Retracement levels, further areas of interest were highlighted. Notably, there was confluence between the 23.6% level and the support at 7.92, making it a strong level of support.
The Awesome Oscillator printed red bars to show that a dip in price was brewing. If the market’s bears succeed in pulling WAVES under $7.92, a move to $7.4 would be likely.
Maker [MKR]
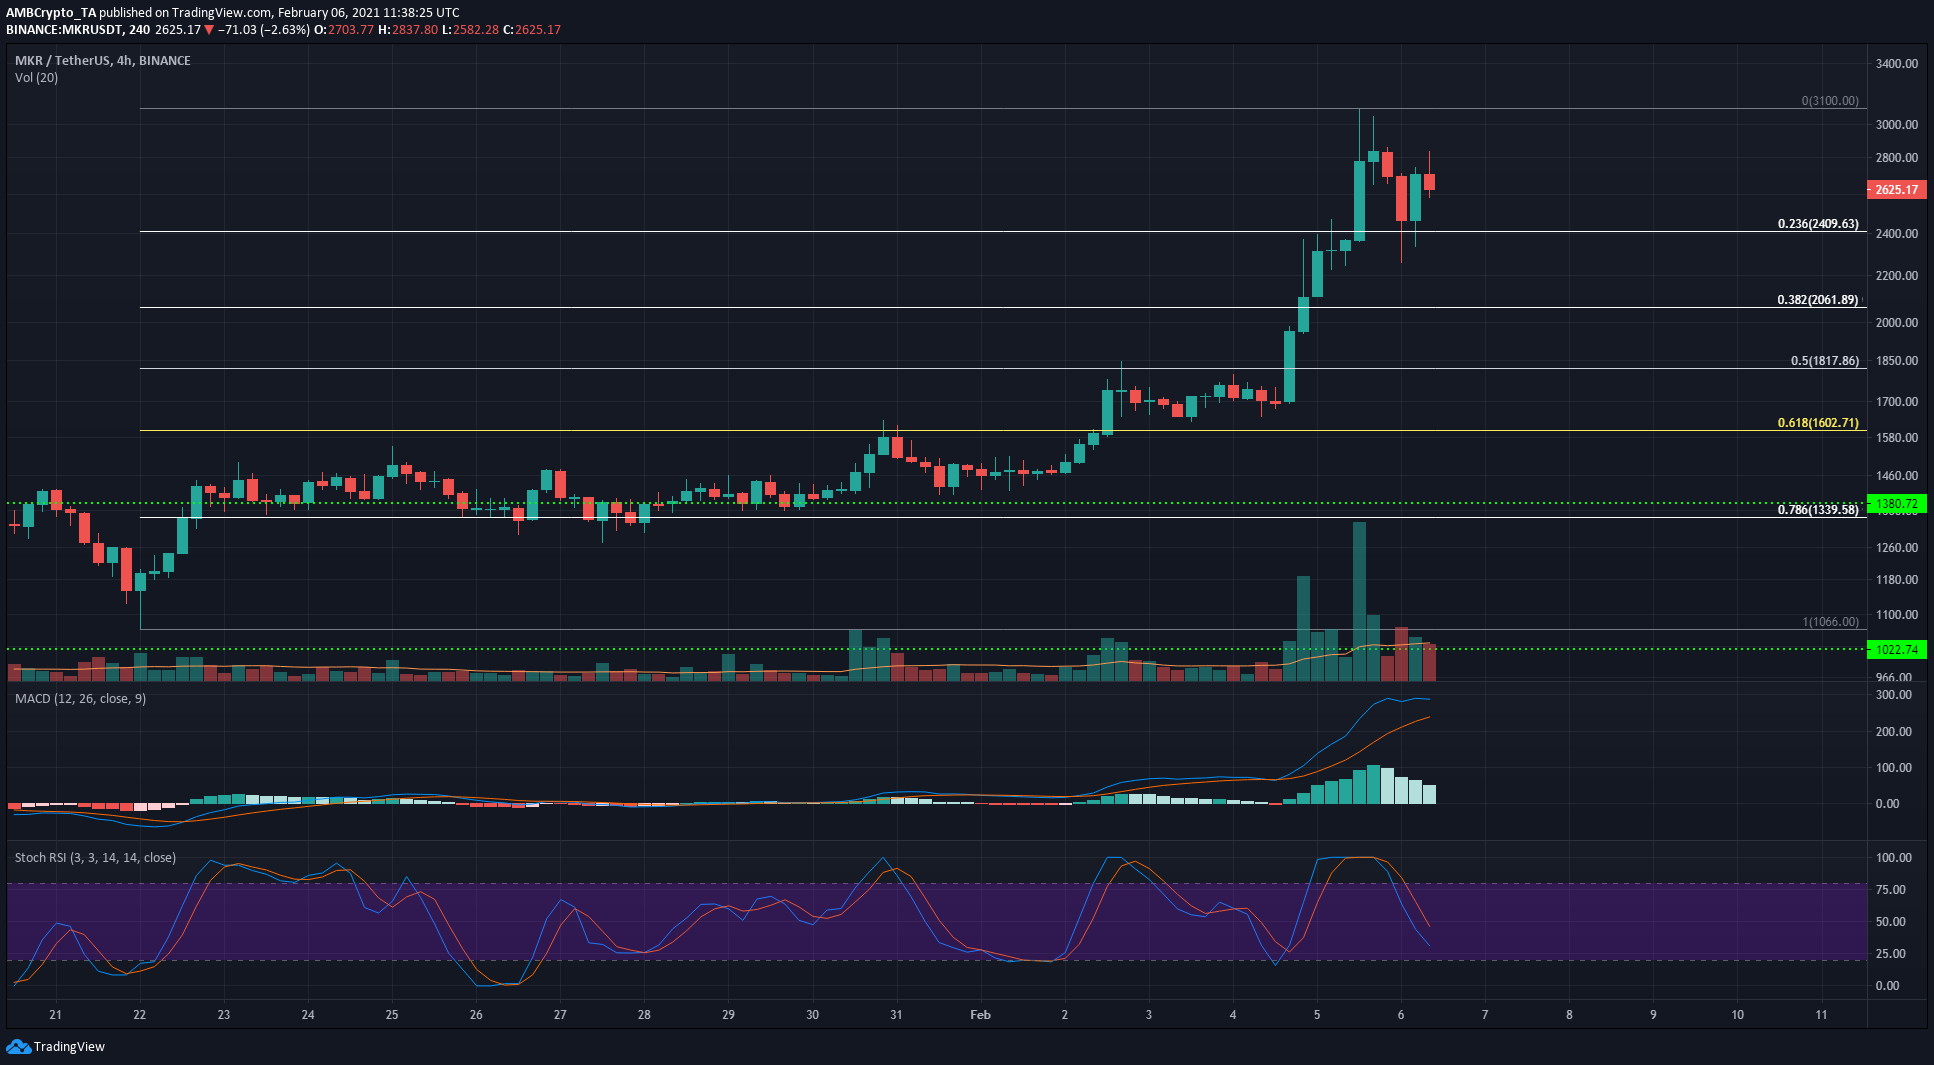
The Stochastic RSI was correcting itself from overbought levels even as the Signal line caught up with the soaring MACD line. Taken together, the conclusion was that bullish momentum was slowing, but a retracement was not yet in effect.
Using the Fibonacci Retracement tool, some levels of support were highlighted. Losing the 23.6% level to the bears will signal a deeper correction for MKR. A subsequent move south would find support at the $2,061 and $1,817-levels.


