XRP: Which way to go? Delineating the effects of previous bull run

Disclaimer: The findings of the following analysis are the sole opinions of the writer and should not be considered investment advice.
XRP’s southbound journey finally retired as the buyers upheld the $0.3 baseline support while orchestrating a bull run over the last few days.
The recent update on the SEC-ripple lawsuit has induced a positive sentiment amongst the buyers while XRP jumped above its EMA ribbons on the daily chart.
Nonetheless, the sellers could now seek to re-enter the market to break the streak of green candles in the coming sessions. At press time, XRP was trading at $0.4638, up by over 0.0% over the last 24 hours.
XRP Daily Chart
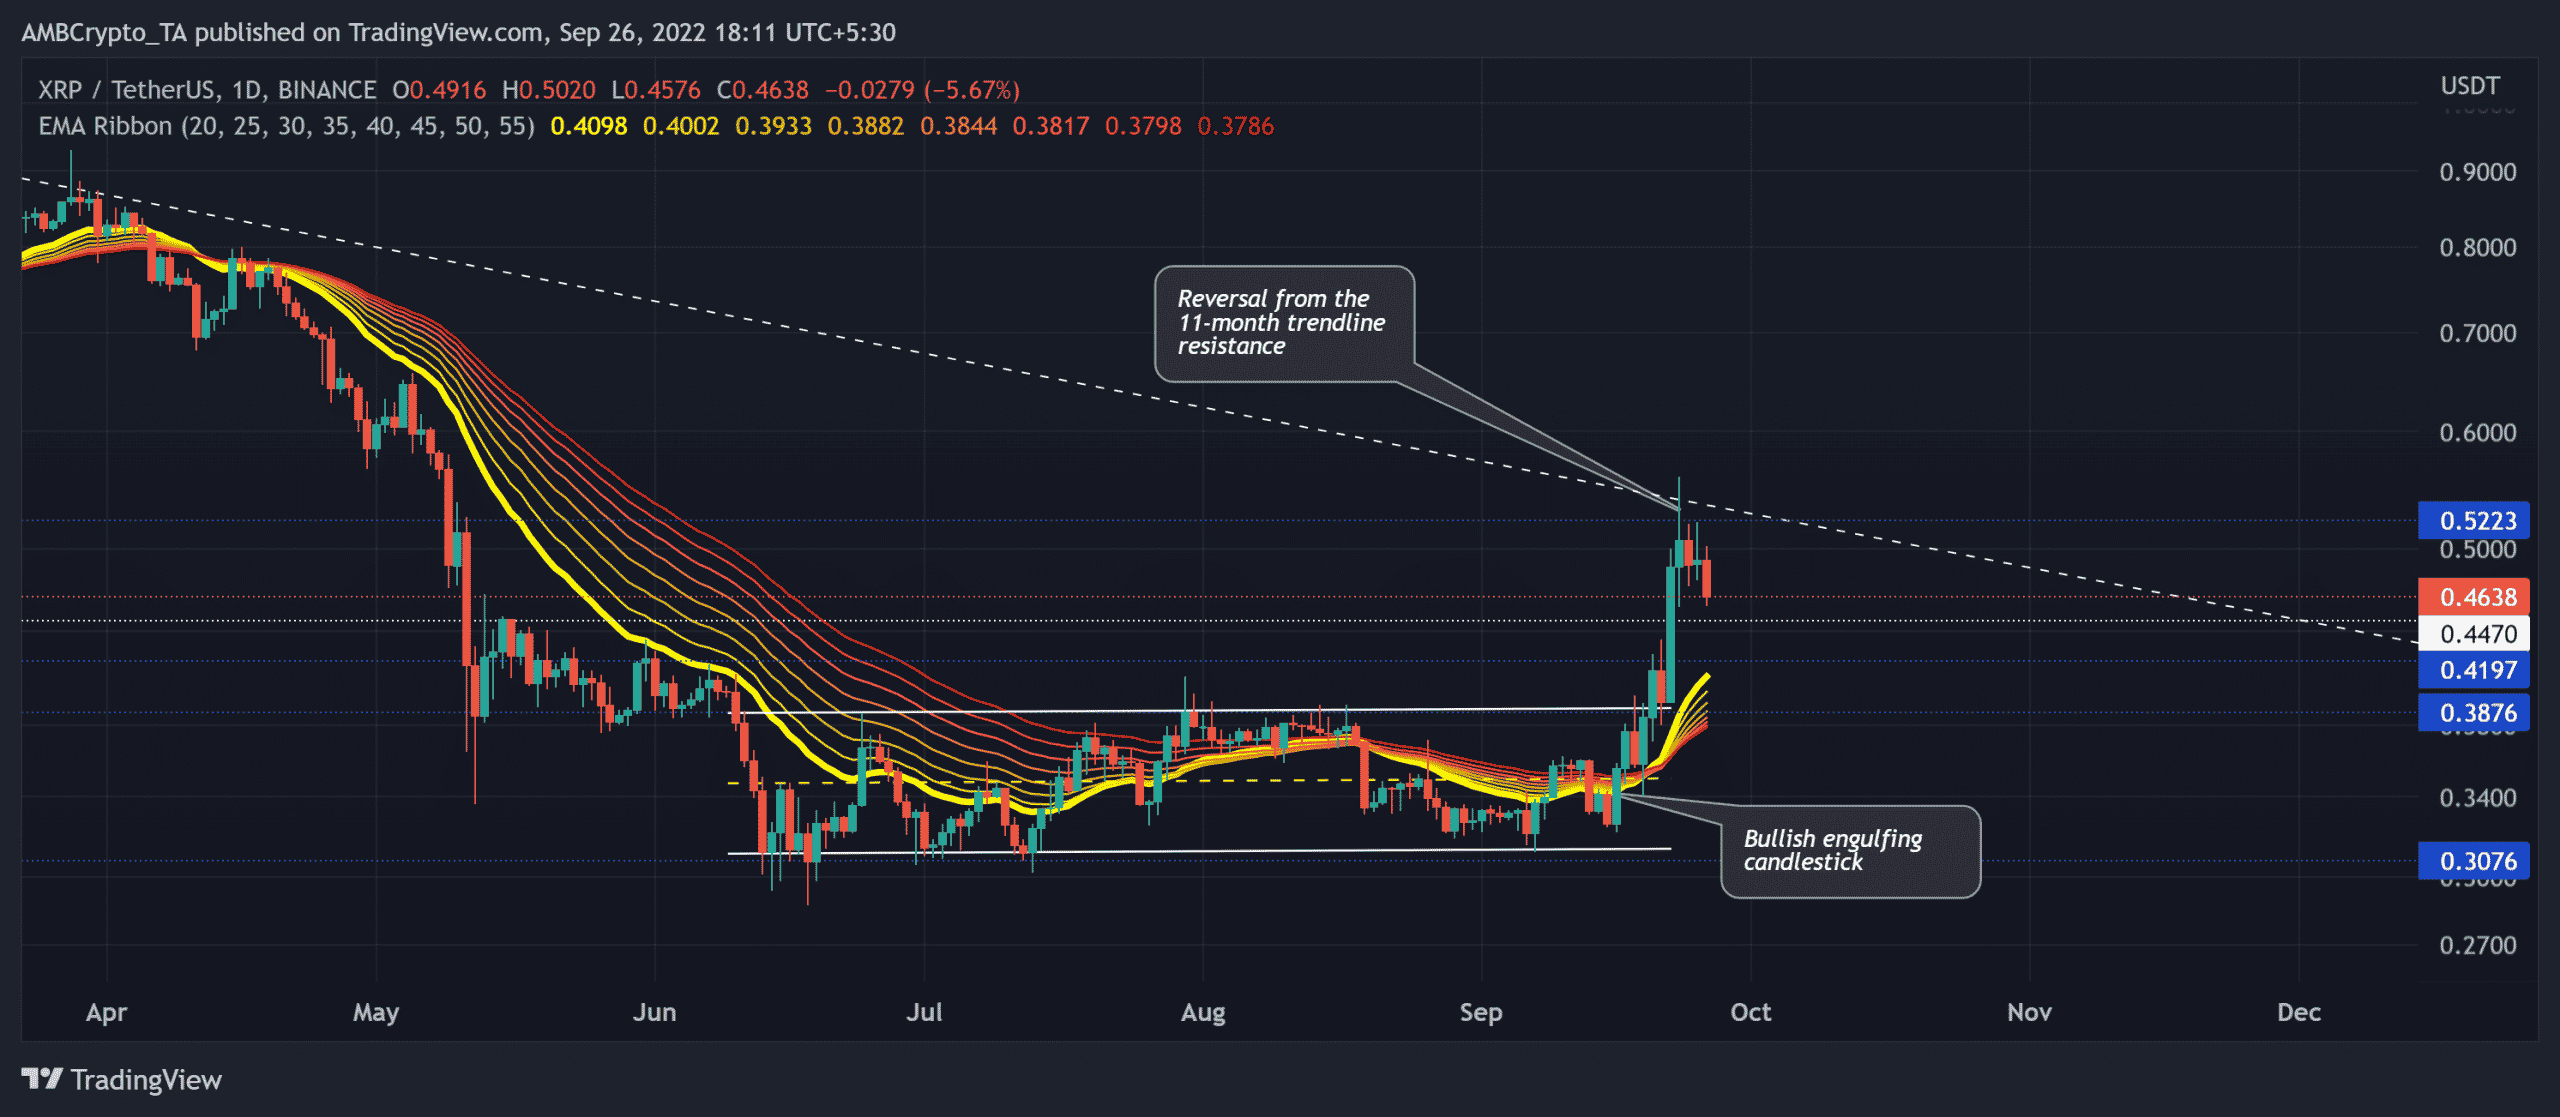
While undertaking a sideways track, XRP consolidated in the $0.3-$0.38 range for over three months. After an expected rebound from the $0.3 baseline, the coin witnessed a bullish engulfing candlestick that set the stage for a patterned breakout.
This rebound registered an over 60% growth in just a week. Consequently, the bullish flip on the EMA ribbons reaffirmed the increased buying strength. But the trendline resistance has provoked selling rallies over the last 11 months.
As a result, the bears could aim to evoke a reversal toward the EMA ribbons. A decline below $0.447 could further increase the chances of this.
In this case, the potential targets would lie in the $0.409 zone. An immediate rebound could retest the long-term trendline resistance before a trend-commital move.
Rationale
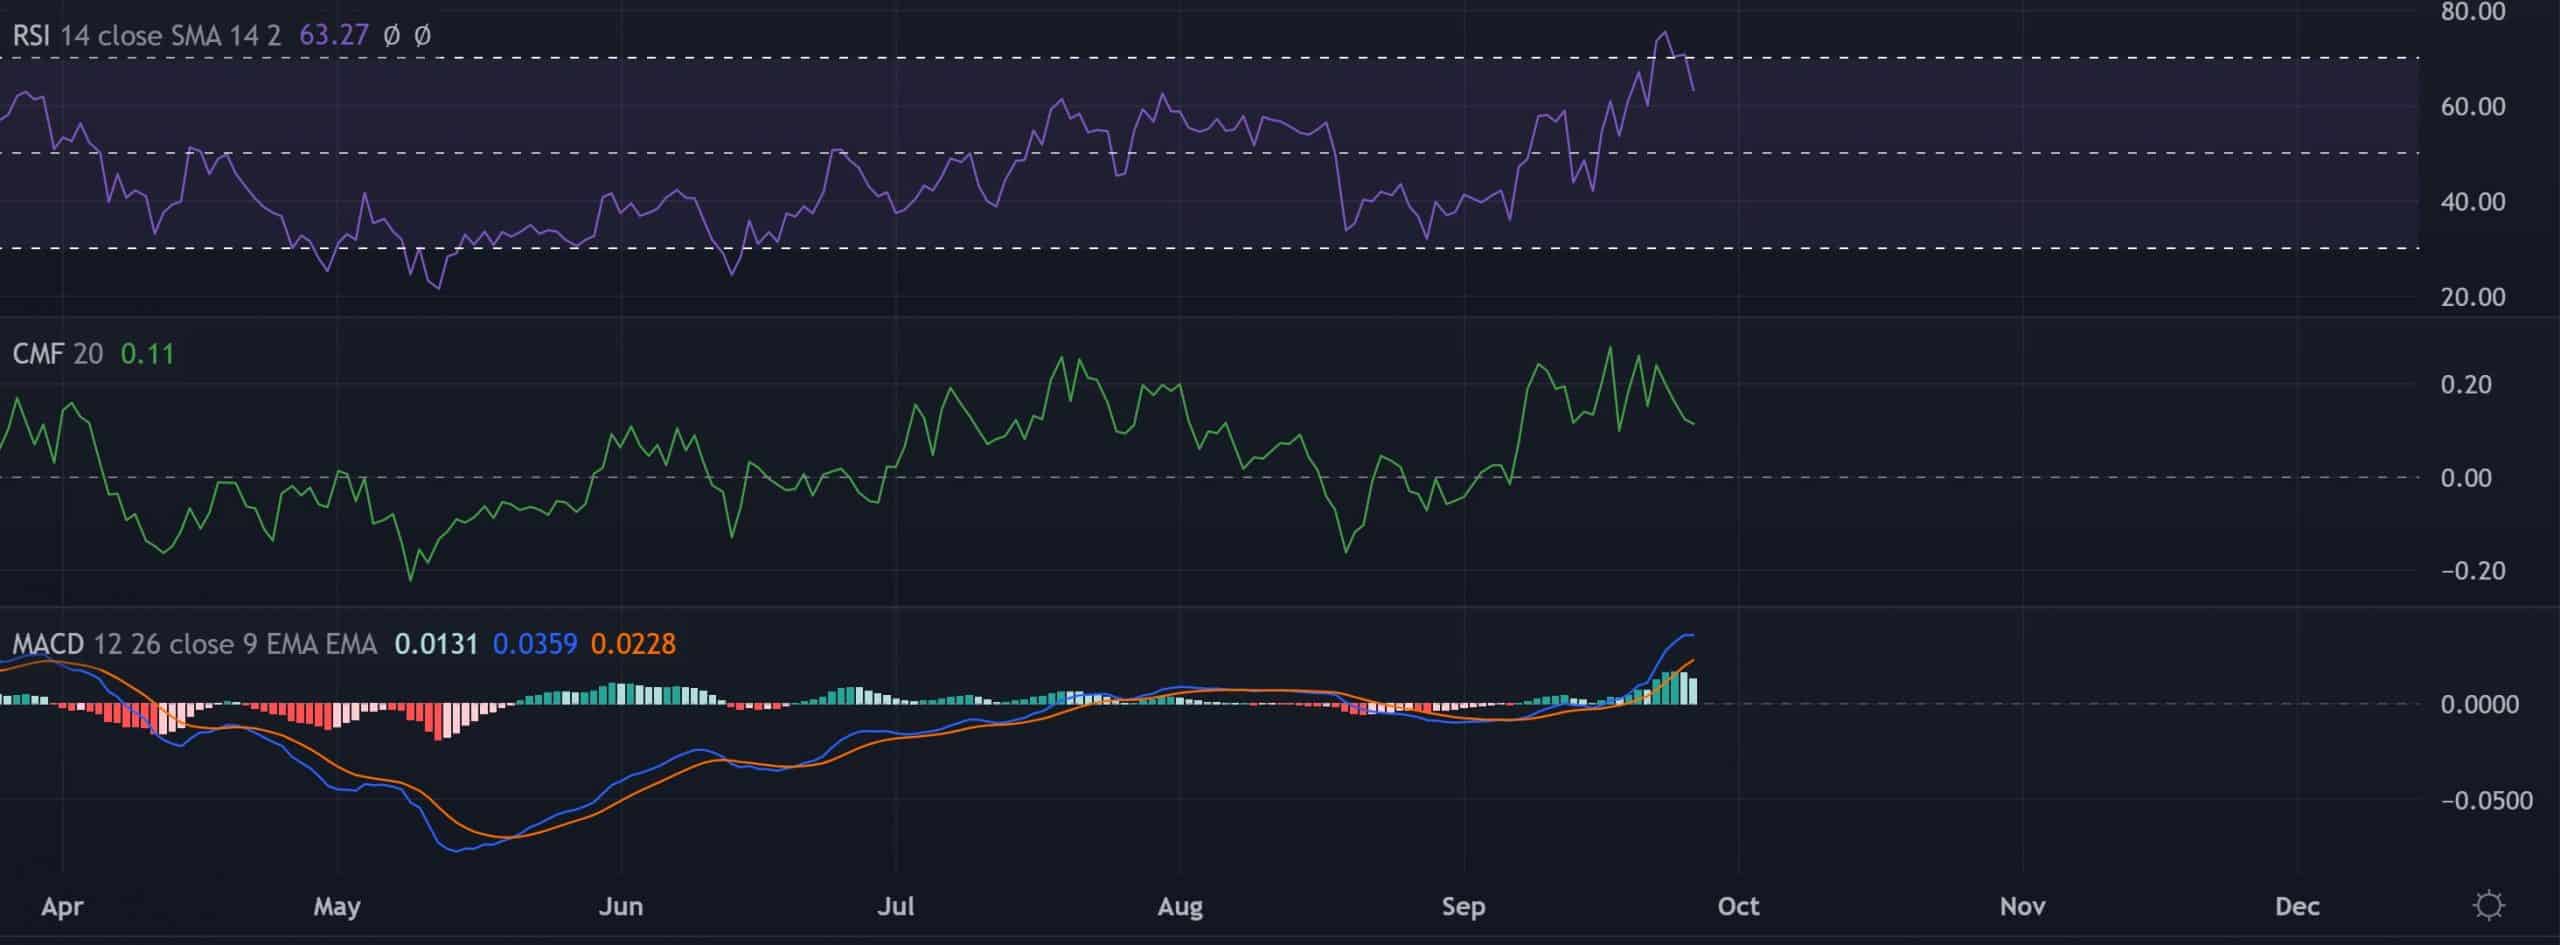
The Relative Strength Index (RSI) entered the overbought region and chalked out an expected reversal. A continued decline toward the midline could hint at an ease in buying pressure.
Furthermore, the Chaikin Money Flow (CMF) marked lower peaks during the price action’s bull run. Thus, this trajectory bearishly diverged with the price.
On the other hand, the MACD revealed a robust bullish edge. Investors should look for a potential bearish crossover to gauge the probability of a downturn.
Conclusion
Given XRP’s reversal from the long-term trendline resistance and the bearish divergence on CMF, the coin could see a near-term pulldown.
But looking at the increased buying pressure, the buyers would likely maintain support along the EMA ribbons to continue the bull run from a long-term perspective. In either case, the targets would remain the same as discussed.
Finally, keeping an eye on Bitcoin’s movement and the broader sentiment would be important to determine the chances of bullish invalidation.


