Analysis
XRP – Will it be more of the same this week for its investors
Disclaimer: The findings of the following analysis are the sole opinions of the writer and should not be considered investment advice
As anticipated by a previous article, XRP broke out of its down-channel (yellow) and entered the $0.75 to $0.79 range. However, it still stayed below its 200 EMA (yellow), keeping its long-term view as a downtrend.
If the buyers continue to build up pressure, as they have over the past week, XRP will eye a retest of its supply zone near the $0.79-mark. This, before testing its immediate trendline support and resuming its near-term uptrend.
At press time, XRP was trading at $0.7625, down by 2.48 % in the last 24 hours.
XRP Daily Chart
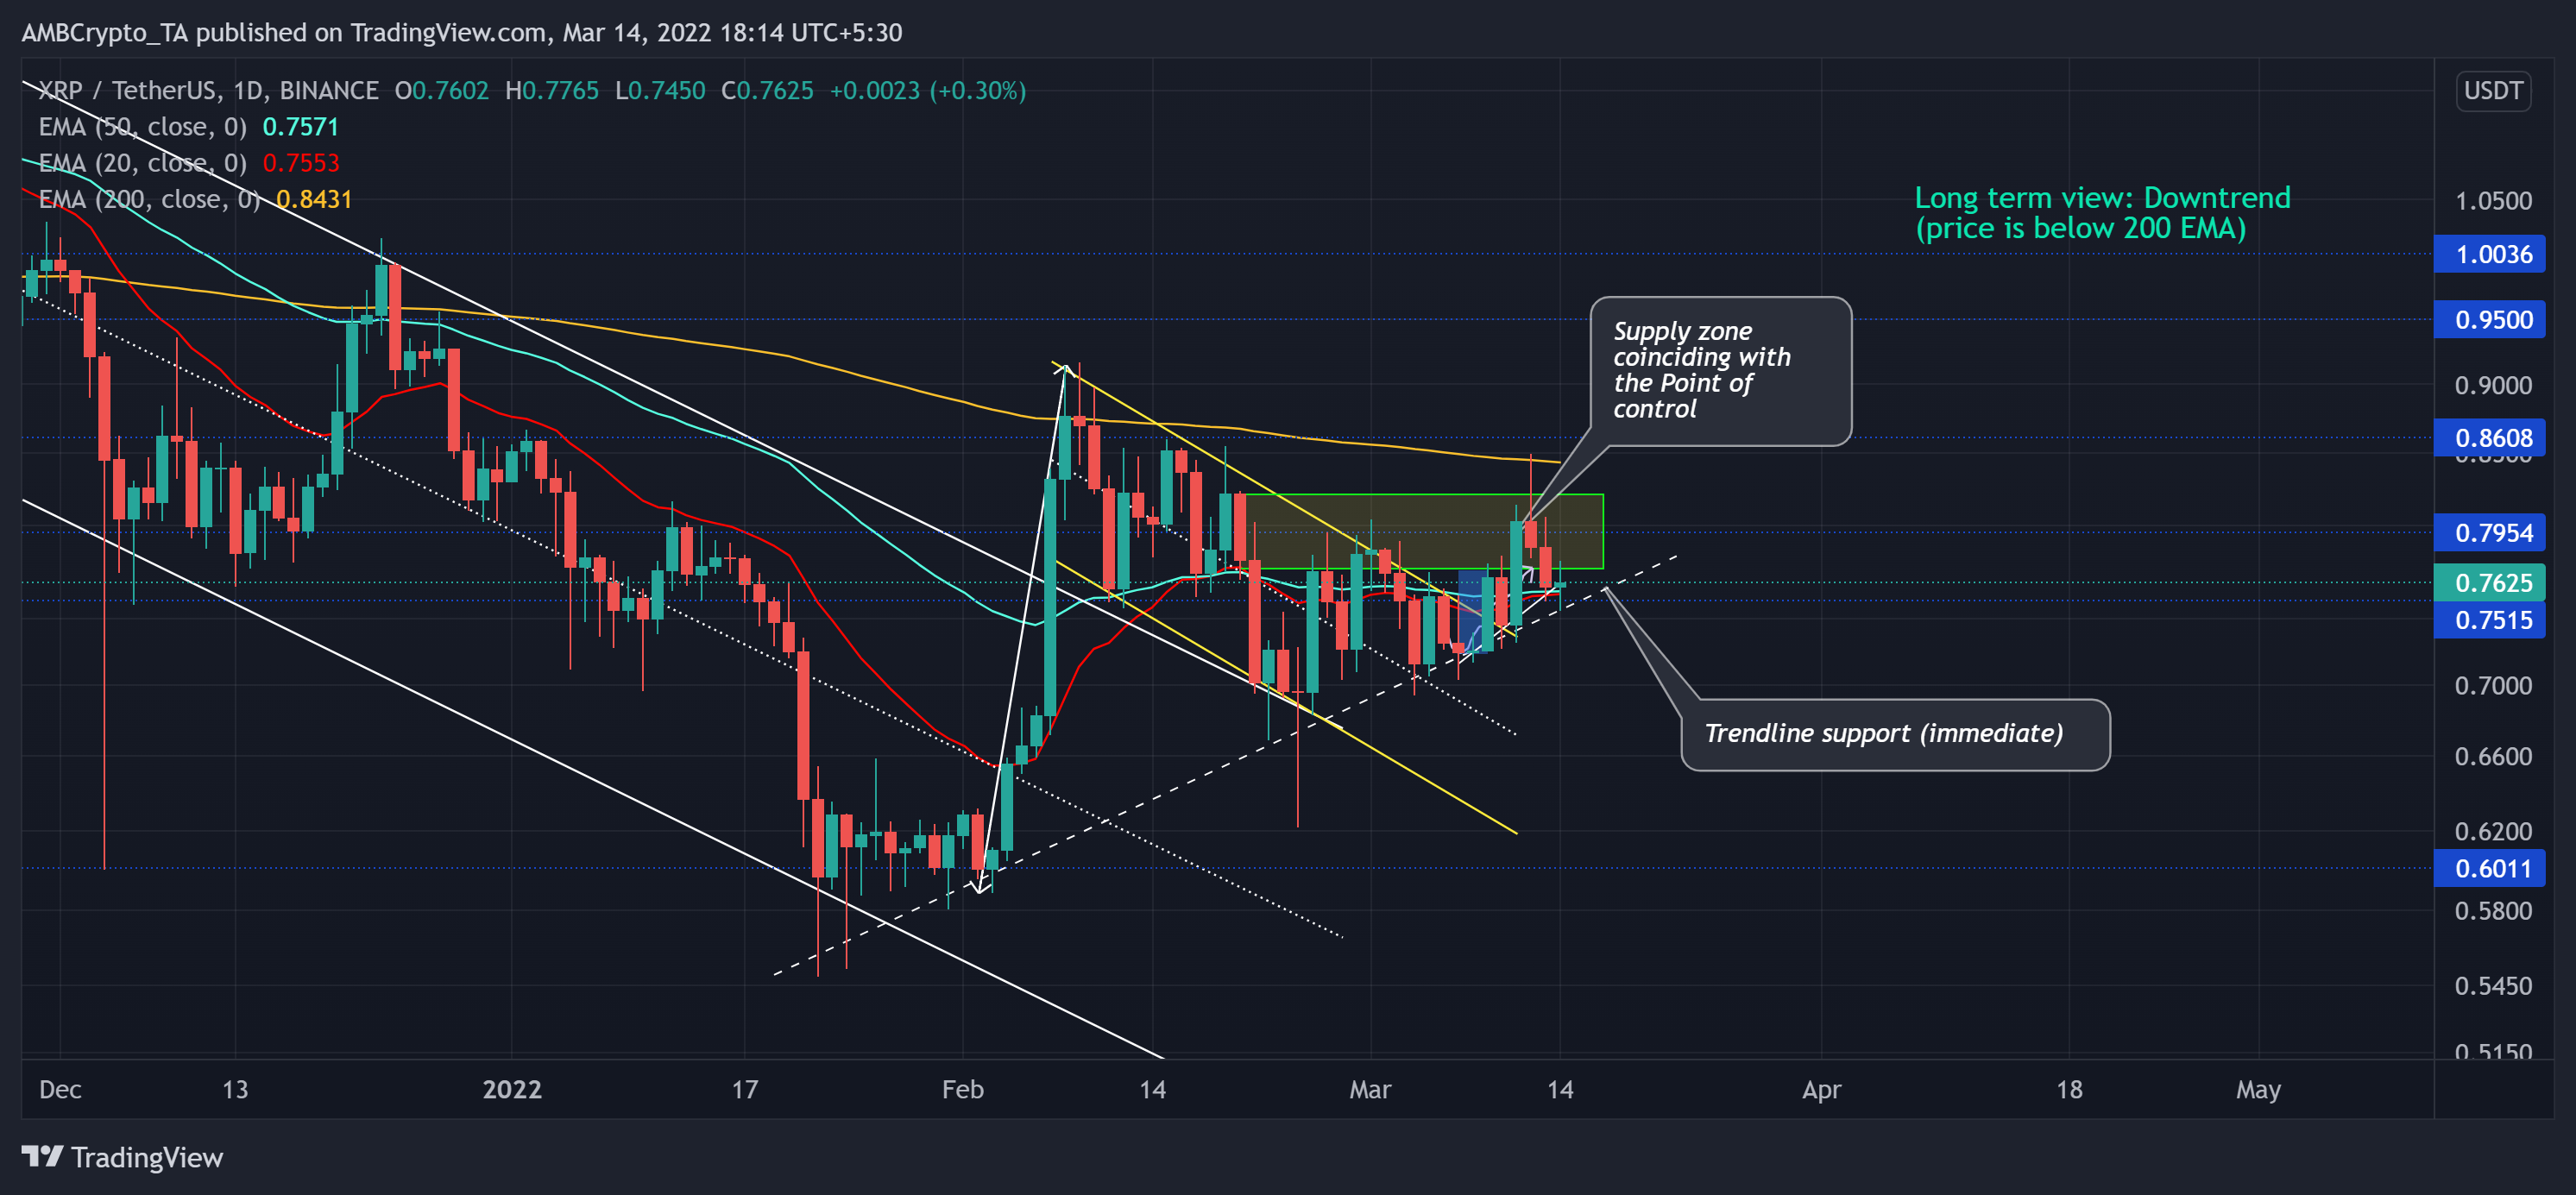
Source: TradingView, XRP/USDT
During the latest bearish phase, XRP declined within a three-month-long down-channel (white) before breaking out from it on 7 February. As it fell below some critical supports (now resistances), the alt hit its 11-month support around the $0.6-level.
Since then, it has registered a 55.08% ROI between 3 and 8 February as it broke out of the channel. Following this, it declined to mark the first retest of the down-channel (white).
Over the last three months, the immediate trendline support (white, dashed) has offered excellent support for the buyers, thus precipitating a near-term uptrend. Meanwhile, the price rose above the 20 EMA (red) and 50 EMA (cyan) on XRP’s daily chart.Now, the bulls flipping the 20 EMA from resistance to support have revealed their underlying influence. A further test of its supply zone followed by a pullback towards its immediate support could be likely. The buyers must defend the $0.75-$0.76 range to support the anticipated recovery chances.
Rationale
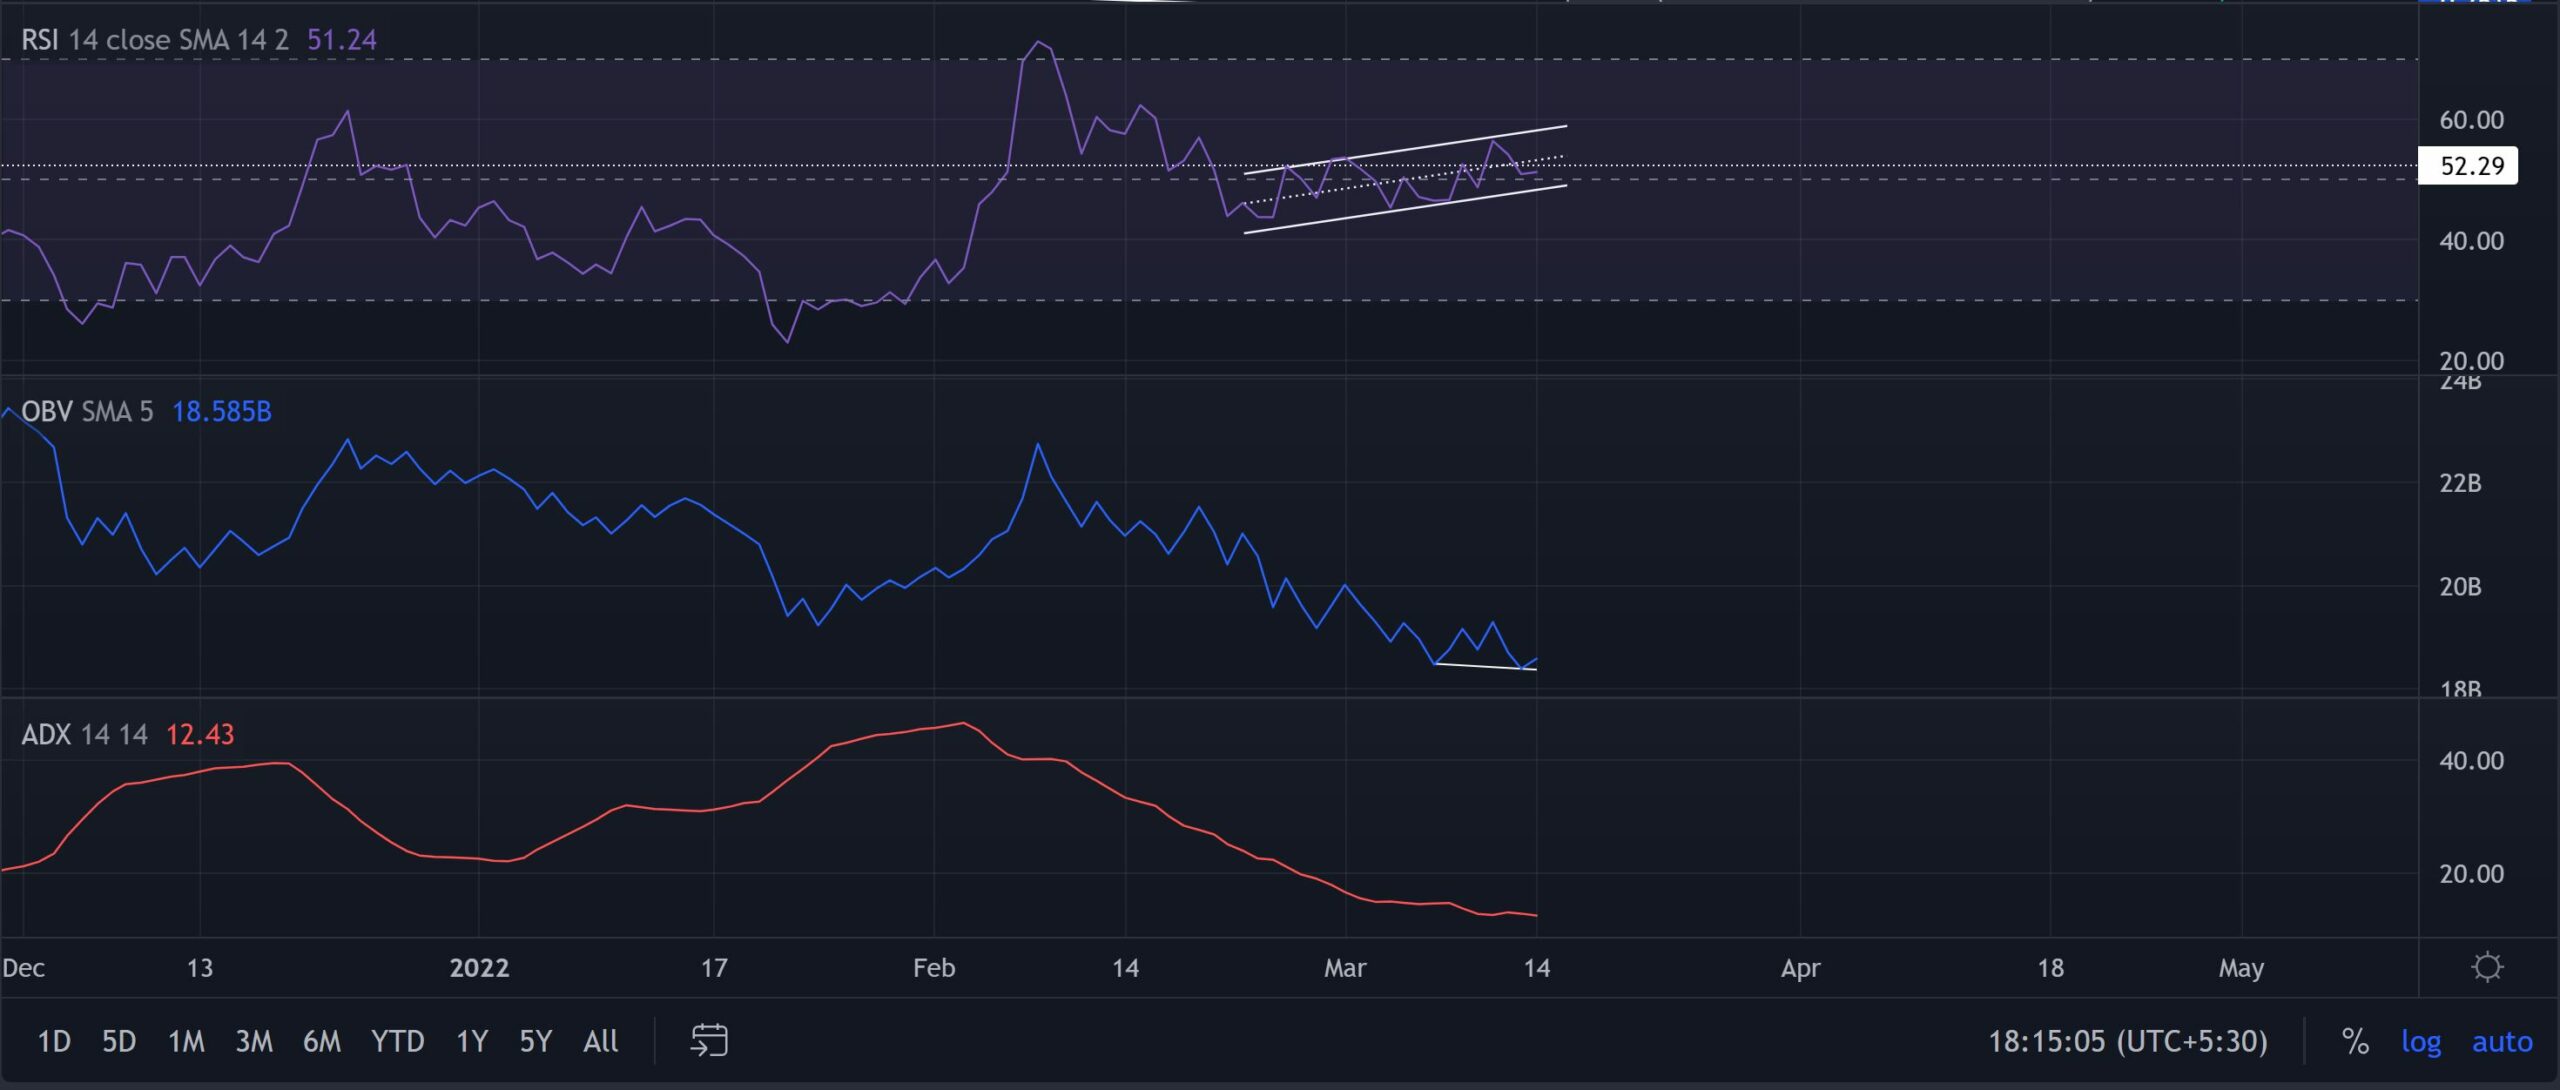
Source: TradingView, XRP/USDT
The RSI pictured a sturdy up-channel recovery as it found itself swaying above the equilibrium. Any close above the 52-mark would heighten the chances of testing the upper trendline of its ascending channel.
Furthermore, the OBV recently marked lower troughs while the price action continued its up-trajectory. This formed a hidden bullish divergence that could support a near-term rally. Nevertheless, the ADX continually depicted a weak directional trend for the alt.
Conclusion
After breaking out of its near-term down-channel (yellow) and rising above its 20/50 EMA, XRP bulls have shown their edge over the bears. Also, keeping in mind the OBV divergence and the RSI improvement, XRP could continue its gradual buying spree whilst maintaining its immediate trendline support.
Besides, keeping an eye on Bitcoin’s movement and the broader sentiment would be important to complement the aforementioned analysis.