XRP’s $2.4 test: Bulls show strength amid mixed signals

- XRP witnessed accumulation within a range over the past month.
- The short-term speculative sentiment was bearish, but a move to $2.4 is anticipated in the near-term.
Ripple [XRP] has a long-term bullish outlook. Its rally to $2.9 was followed by a range formation that witnessed steady accumulation from the bulls.
Experienced commodities trader and classical chartist Peter Brandt recently called for a $500 billion market cap for XRP.
XRP range formation and the next buying opportunity
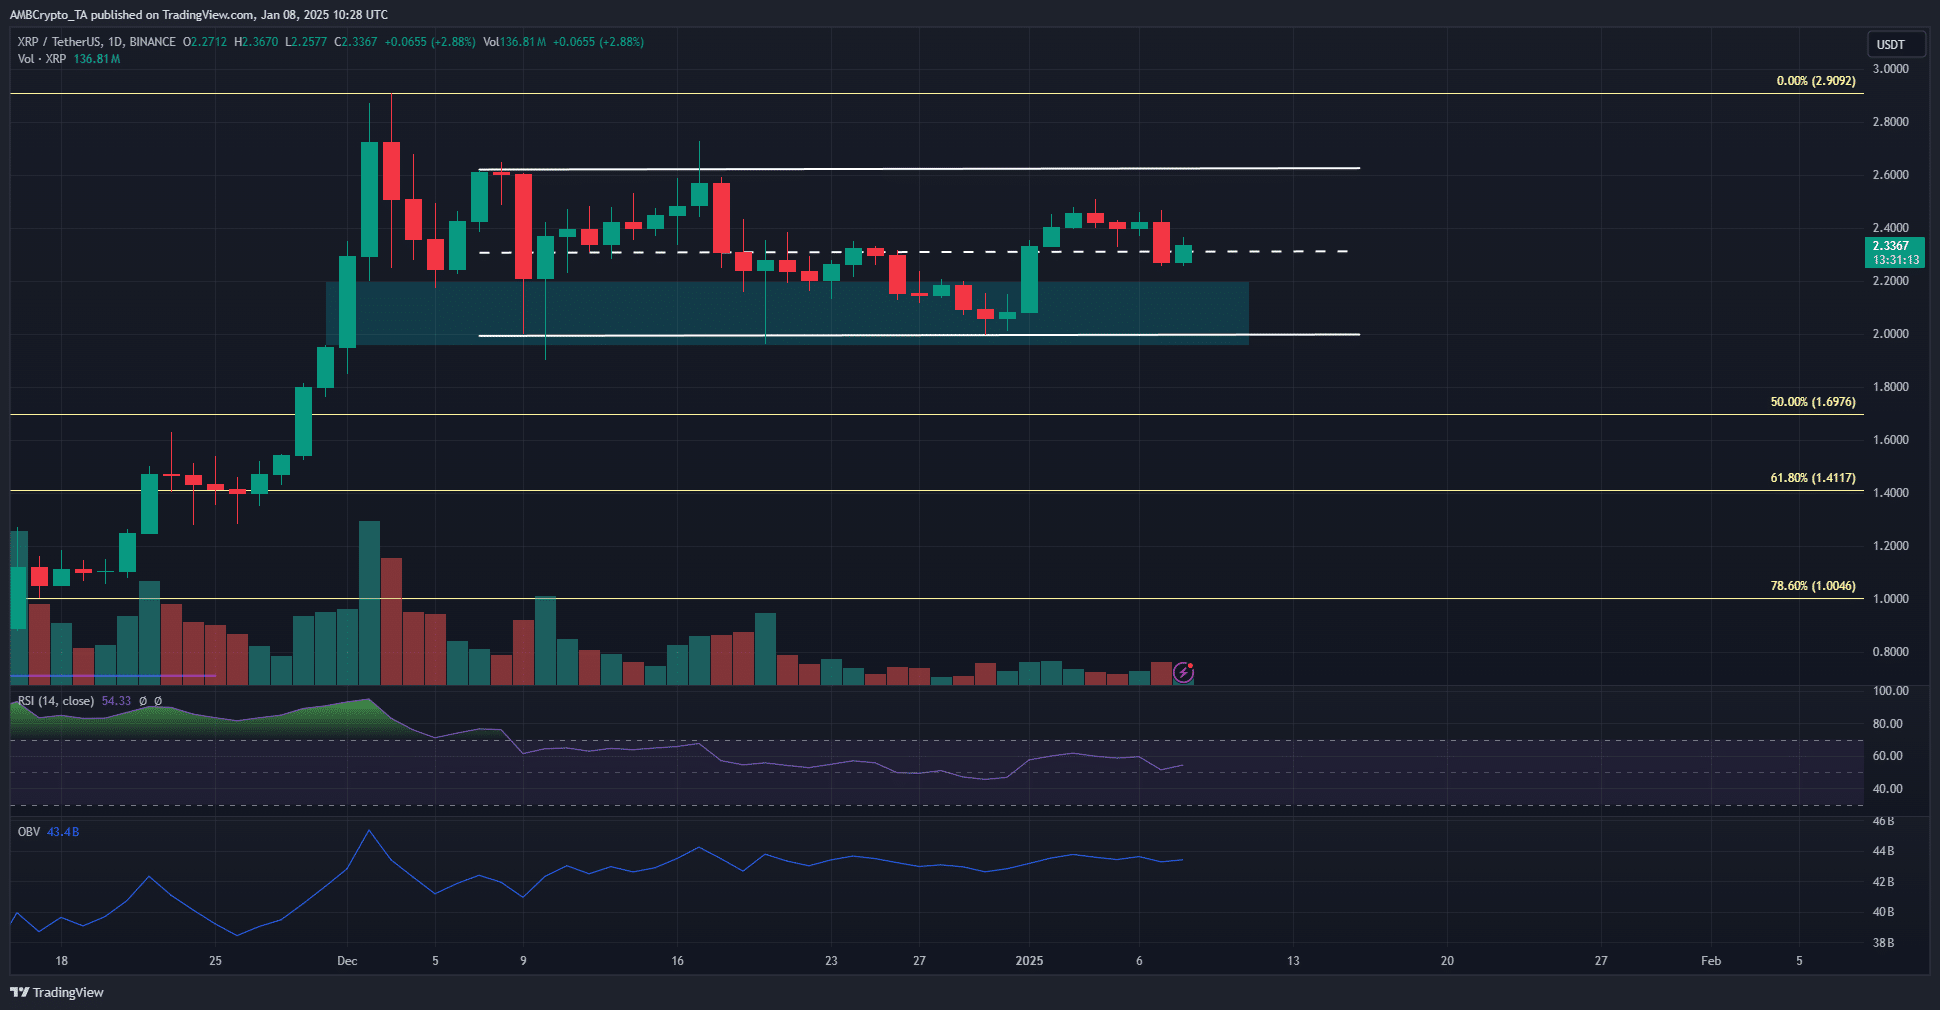
For a month, XRP has traded within a range that extended from $2 to $2.62. The mid-range level at $2.31 has served as both support and resistance over the past month, and at press time was resistance.
To the south, a fair value gap from late November was the next demand zone that XRP could see a bullish reaction from. Despite the range formation, the OBV has slowly climbed higher over the past month.
This was an encouraging sight, and showed selling pressure was weak. The RSI on the daily chart also stayed above neutral 50 to signal bullish momentum was prevalent.
A revisit of the range lows or even the $1.9 level would be a long-term buying opportunity.
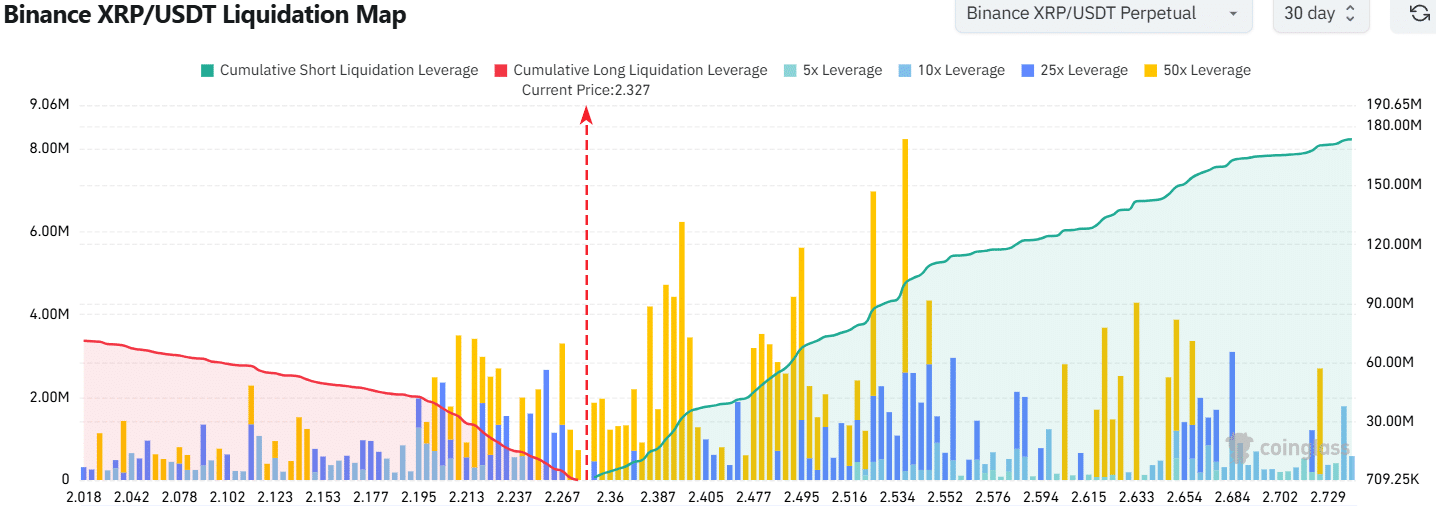
Short liquidations abound overhead

Source: Coinglass
The liquidation map of the past month showed a considerable cluster of high leverage liquidation levels between $2.33 and $2.4. The cumulative liquidation leverage to $2.4 outweighed that toward $2.21.
This meant that a move northward would result in a higher volume of liquidations.

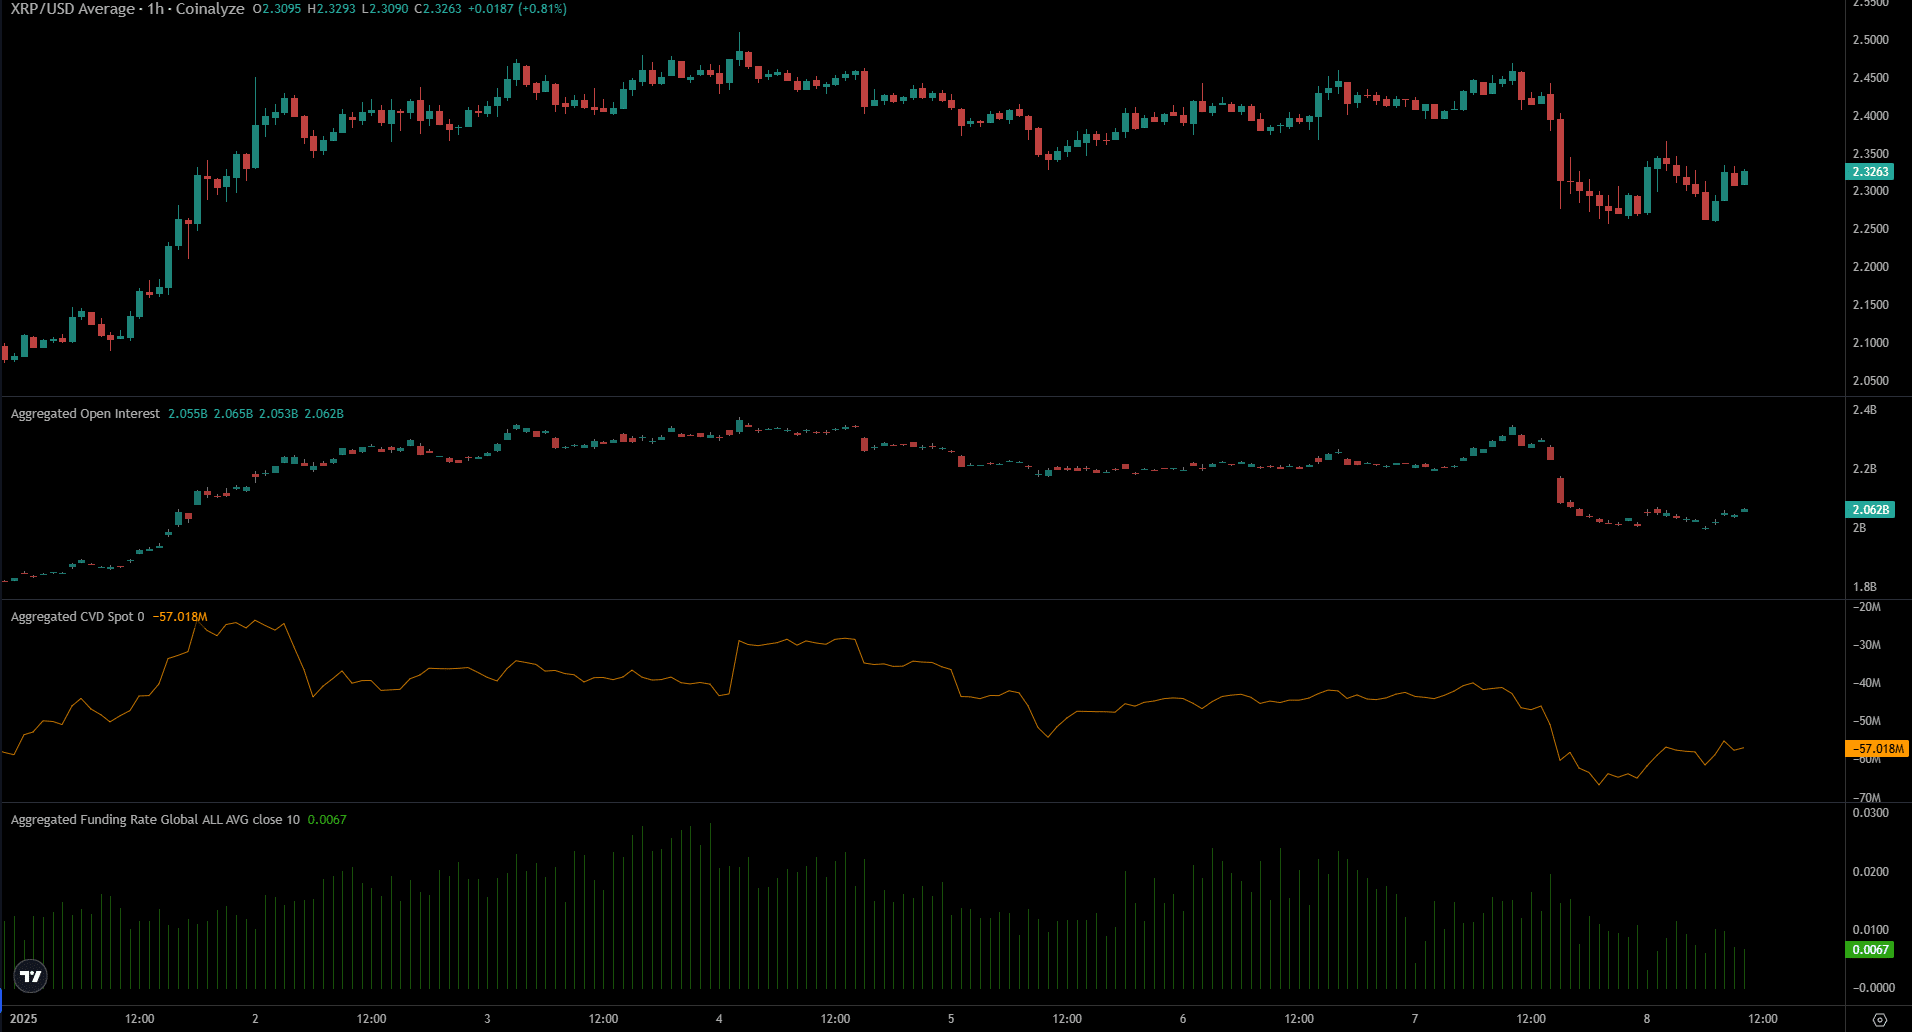
Source: Coinalyze
The Open Interest and spot CVD have both tumbled lower over the past 24 hours. This was a consequence of the market-wide selling pressure brought by Bitcoin’s [BTC] drop. The Funding Rate also fell lower.
Together, the short-term data showed sentiment was bearish.
Realistic or not, here’s XRP’s market cap in BTC’s terms
The liquidation map hinted that a move near the range highs was more likely in the coming days. Whether a range breakout will follow was unclear.
Swing traders must be prepared to take profits during such a move, and can look to rebuy $2.35-$2.4 during a retest as support.
Disclaimer: The information presented does not constitute financial, investment, trading, or other types of advice and is solely the writer’s opinion


