Analysis
XRP’s bullish fakeout leads to more bearish intrusion
The volatile crypto-market saw the price of XRP suffering for five consecutive days, even though this fall was expected much sooner. After slipping however, XRP returned to its comfortable price of $0.2407 at press time, with a market cap of $10.46 billion.
The short-term chart for XRP reflected it breaching an imminent bearish pattern, which then resonated with the pattern to cause the price of XRP to tumble.
1-day

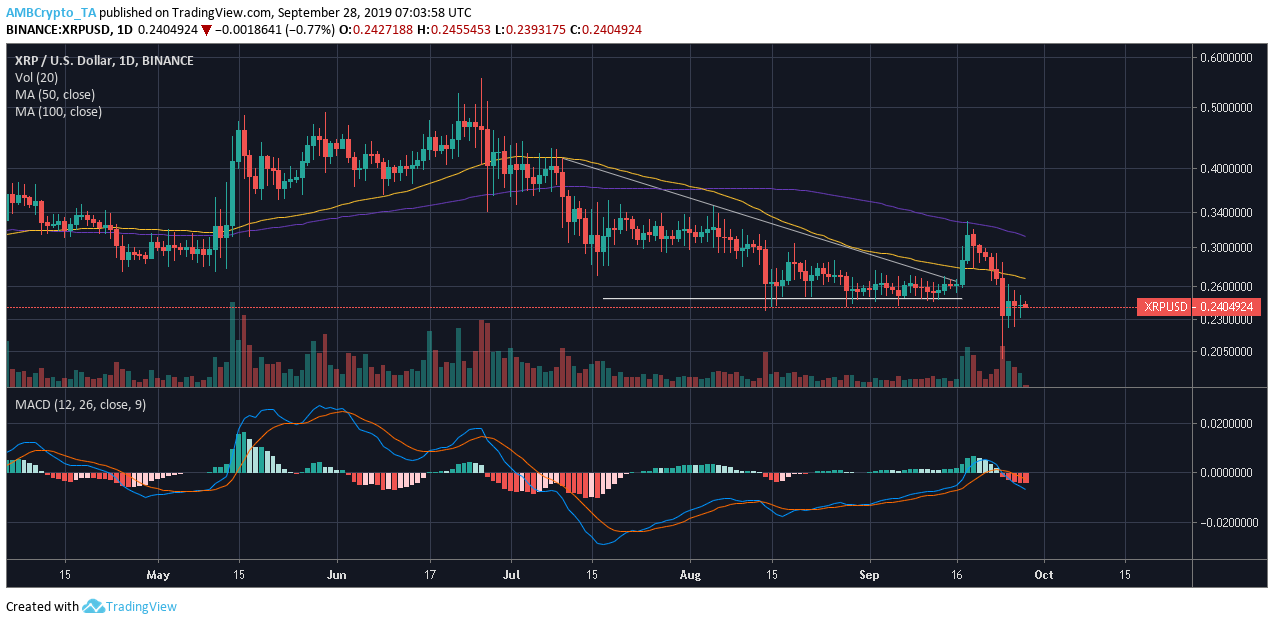
Source: TradingView
The one-day chart for XRP suggested the formation of a descending triangle, bridging the lower highs at $0.4130, $0.3500, and $0.2685. The horizontal trend line marked support at $0.2483. XRP’s price was expected to collapse. However, the pattern was busted after two strong green candlesticks emerged on the chart. The coin reported a growth of 29.13% over two days, immediately followed by a fall of 37.83% over five days.
The 50 moving average was resting under the 100 moving average, making it a bearish market. This bearish trend was confirmed by the MACD line, that laid under the signal line too. The price of XRP was reported to be $0.2421, at press time.
Conclusion
According to the busted breach of the descending triangle, XRP reported strong growth followed by an immediate correction. The trend in the XRP market remains bearish.