Analysis

XRP’s collective breach of ascending channels raises red flags
Posted:
| Last updated: January 30th, 2024

XRP’s price has been under immense volatility off late.
24th September marked a collective fall for the entire crypto industry after which XRP continued to recover its valuation. The third-largest asset began to experience repeated surges and crash, but the token continued to consolidate between the resistance of $0.333 and $0.275 during the time period. At press time, XRP went under the support of $0.275.
On further analysis, it was observed that XRP may have entered a significant bearish period in both the long and short term.
1-hour chart
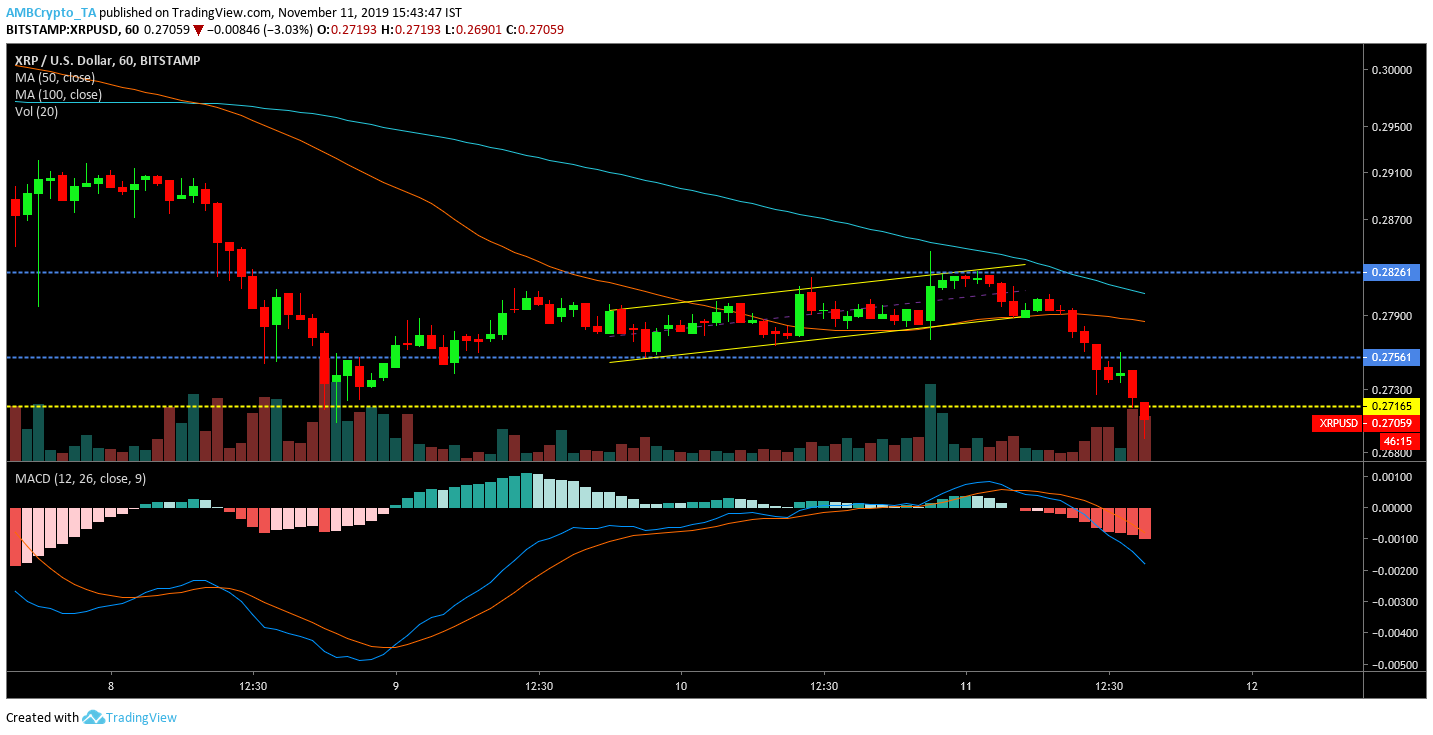
XRP/USD on Trading View
As mentioned earlier, XRP’s price was under the long term support of $0.275. Before the price navigated under the support, the valuation mediated within the trend lines of an ascending channel. From 9th to 11th November, the pattern was observed, following which a bearish breakout surfaced. The pullback dragged the valuation of XRP further down and the support of $0.275 was breached.
50-Moving Average and 100-Moving Average were also observed, completing a bearish crossover on 8th November; MACD indicator was significantly bearish as well.
4-hour chart
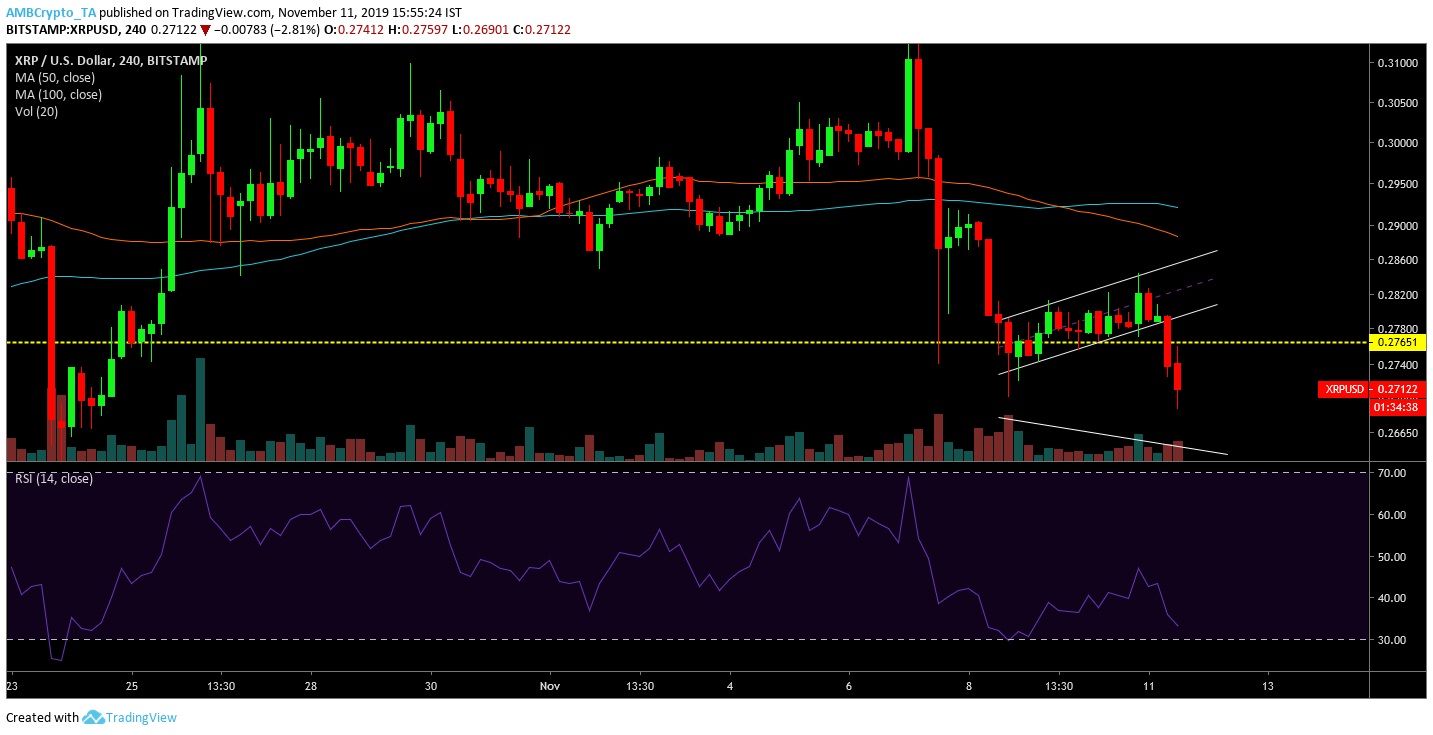
XRP/USD on Trading View
XRP’s 4-hour chart exhibited the formation of a similar bearish pattern. An identical ascending channel was formed in the chart which was breached at press time. The 4-hour chart also witnessed a decreasing trading volume during the same period, confirming the validity of the bearish drop.
Likewise, Relative Strength Index was hugely indicative of a bearish trend, as the indicator was heading toward the over-sold section.
Additionally, the 50 and 100 Moving Averages also completed a bearish trend reversal.
1-Day Chart
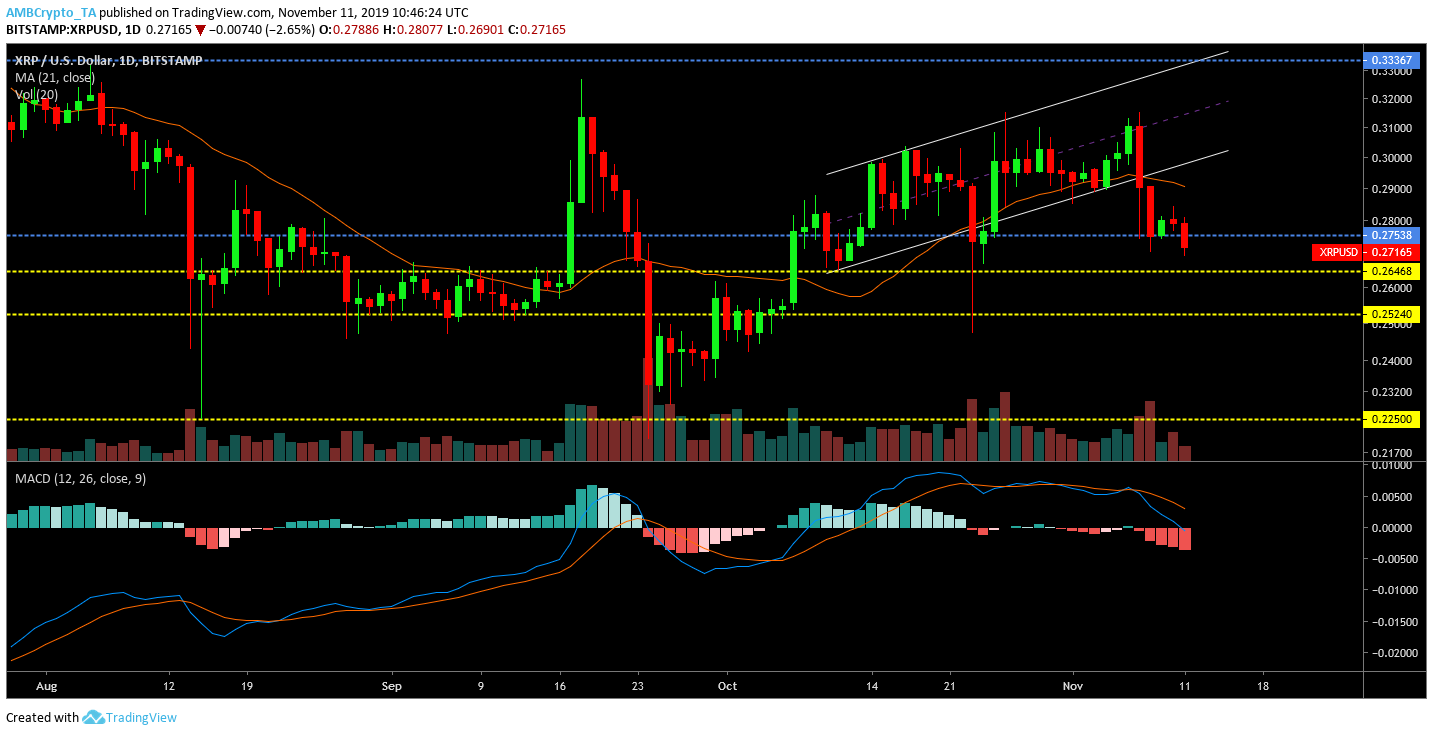
XRP/USD on Trading View
During analysis, a similarity between 1-hour and 4-chart is usually observed due to its short-term metrics. However, after observation, XRP’s long term 1-day chart bore a similar resemblance as well. An ascending channel was pictured as the pattern was breached with a bearish pullback, devaluing XRP’s price to under $0.275. The trading volume was inconsistent, hence it did not pin-point towards a trend but MACD was evidently bearish in the long term.
Rare comparability between the short-term and long-term charts indicated that XRP’s valuation may face strong bearish force in the coming weeks.


