- Market sentiment around XRP remained consistently bearish
- Technical indicators seemed to support this outlook too
Like several other cryptos, XRP’s price also recorded a correction in the last 24 hours. However, there is more to the story as the token may be mimicking an old trend that previously resulted in a massive bull rally. Hence, the question – Will history repeat itself again?
A historical trend to follow?
According to CoinMarketCap, XRP bears controlled the token’s price in the last 24 hours as its value dropped by more than 1%. At the time of writing, the token was trading at $0.515 with a market capitalization of over $28.5 billion, making it the 7th largest crypto on the charts.
The altcoin’s bearish price action had a negative impact on the token’s social metrics too. Especially since its social volume dropped slightly over the last few days. Additionally, its weighted sentiment remained low too.
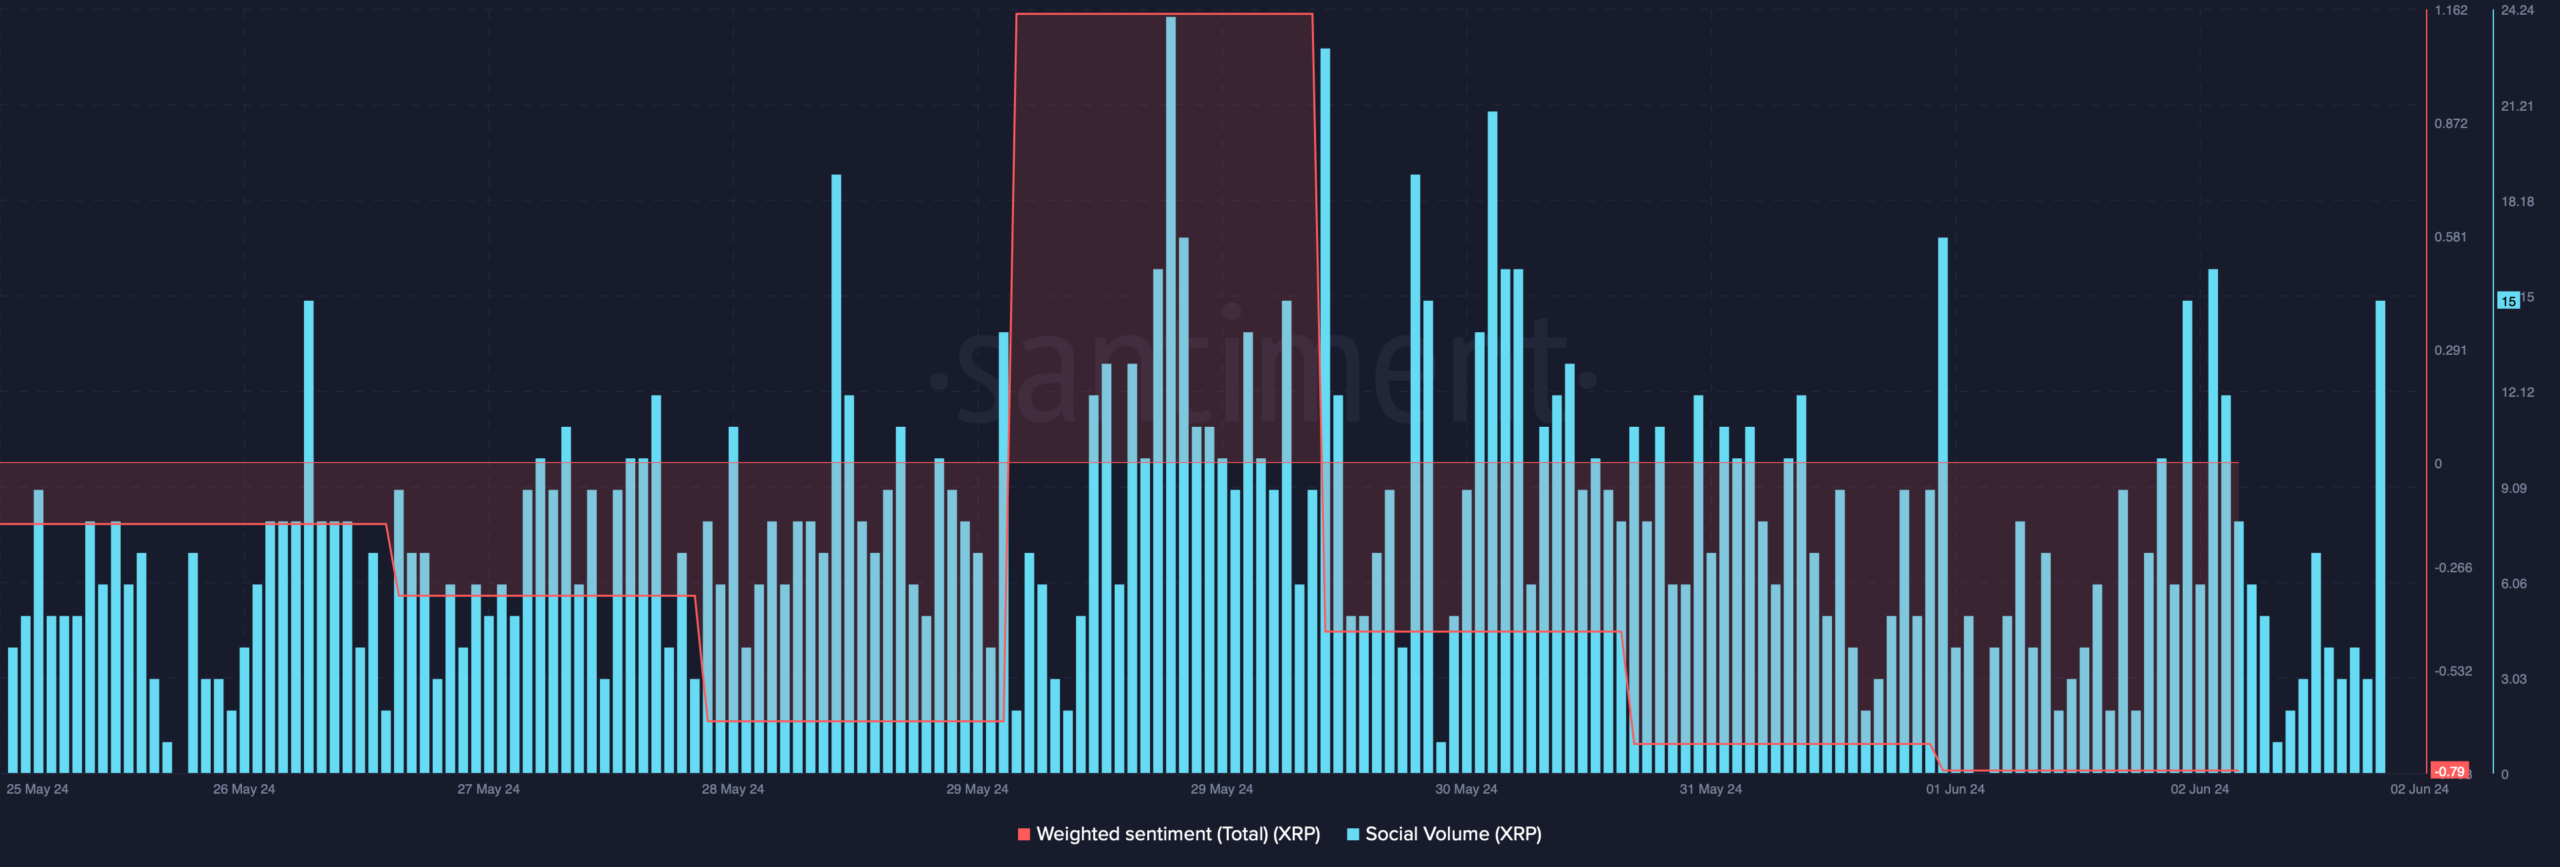
Source: Santiment
However, investors must not get disheartened, as the token is following a historical trend. Milkybull, a popular crypto-analyst, recently shared a tweet highlighting that XRP has been following a pattern similar to that of 2017 and 2020. According to the analyst,
“$XRP is currently at a level in 2017 and 2020 that sparked off a massive rally.”
Here, the interesting bit is that the last few times XRP followed this pattern, it soon recorded major price upticks on the charts. Could this be a sign of incoming trend reversal?
Is XRP poised for a bull rally?
Since historical trends suggested a bull rally, AMBCrypto then analyzed the token’s metrics to better understand whether things can turn in investors’ favor in the short term. As per our analysis of Santiment’s data, buying pressure on XRP increased as its exchange outflows spiked last week.
On top of that, its supply on exchanges also dropped, further proving the fact that investors have been buying the token.
On the contrary, its MVRV ratio dropped last week – This can be interpreted as a bearish metric for the altcoin.
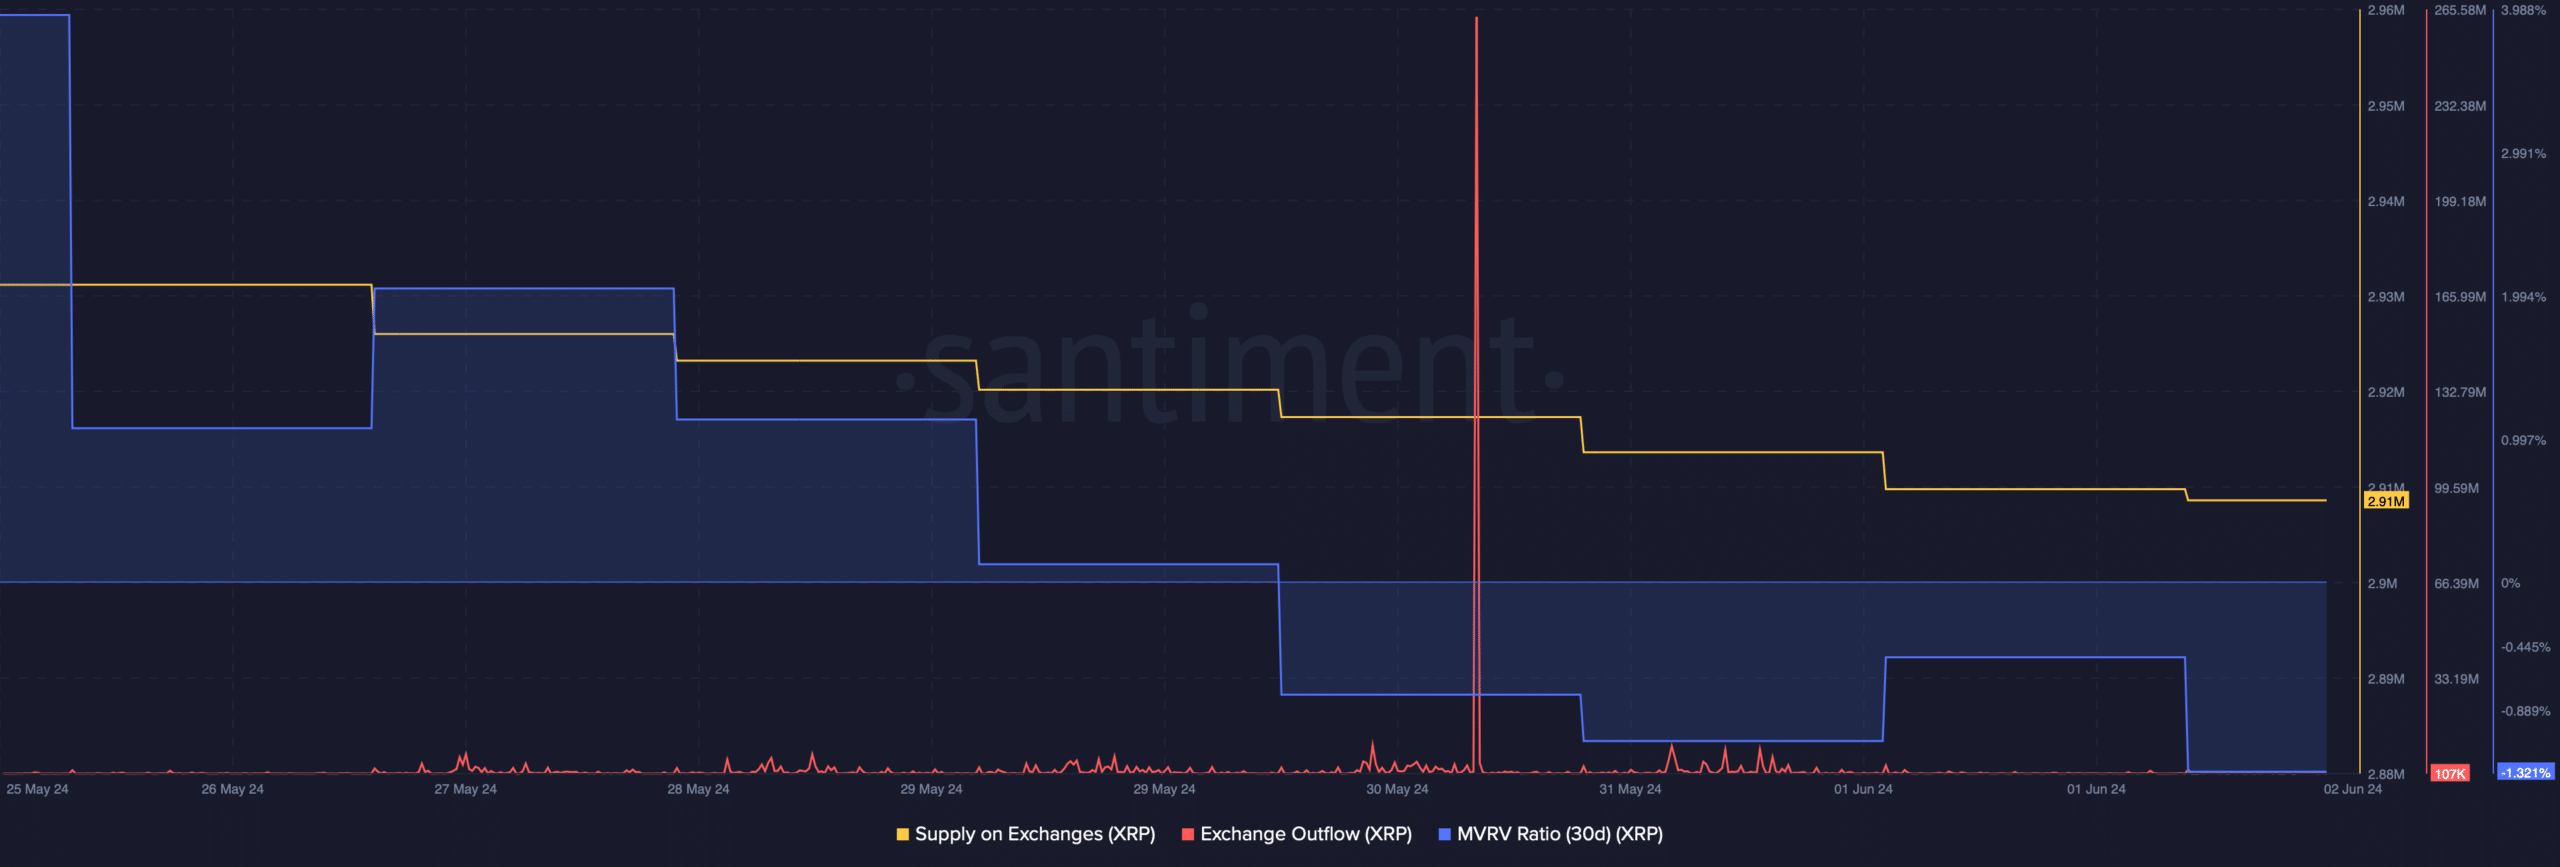
Source: Santiment
Amidst all this, AMBCrypto found that at press time, the token’s Fear and Greed index had a value of 29%, meaning that the market was in a “fear” phase. Whenever the metric hits that level, it is expected that a price uptick will soon follow suit.
We then took a look at its daily chart to better understand what to expect from the altcoin in the near term.
Realistic or not, here’s XRP’s market cap in BTC’s terms
Though the Fear and Freed index hinted at a trend reversal, market indicators continued to remain bearish. The MACD flashed the possibility of a bearish crossover.
Finally, its Relative Strength Index (RSI) noted a downtick on the charts. Contrary to the findings of some metrics, the indicators suggested that the chances of XRP continuing its southbound rally were high.

Source: TradingView


![Story [IP] price prediction - Traders, look out for this key divergence!](https://ambcrypto.com/wp-content/uploads/2025/06/Story-IP-Featured-400x240.webp)