- XRP’s daily and weekly charts flashed red, at press time
- While a few metrics seemed bullish, the rest suggested otherwise
Like several other cryptos, XRP has also recorded multiple corrections over the past week. However, investors might soon see a trend reversal, especially as a bullish pattern appeared on XRP’s chart. Thanks to the same, the token seemed to be on the verge of breaking out.
Hence, it’s worth looking at XRP’s current state to better understand what to expect in the short term.
A bullish pattern on XRP’s chart
According to CoinMarketCap, XRP’s price dropped by nearly 2% in the last 7 days. This declining trend continued over the last 24 hours too, with the altcoin valued at $0.4755 with a market capitalization of over $26.4 billion at press time.
However, better news may be ahead. ZAYK Charts, a popular crypto analyst, recently shared a tweet highlighting a bullish falling wedge pattern. XRP had started to consolidate inside the pattern in March, and at the time of writing, it seemed to be on the verge of breaking out of it.
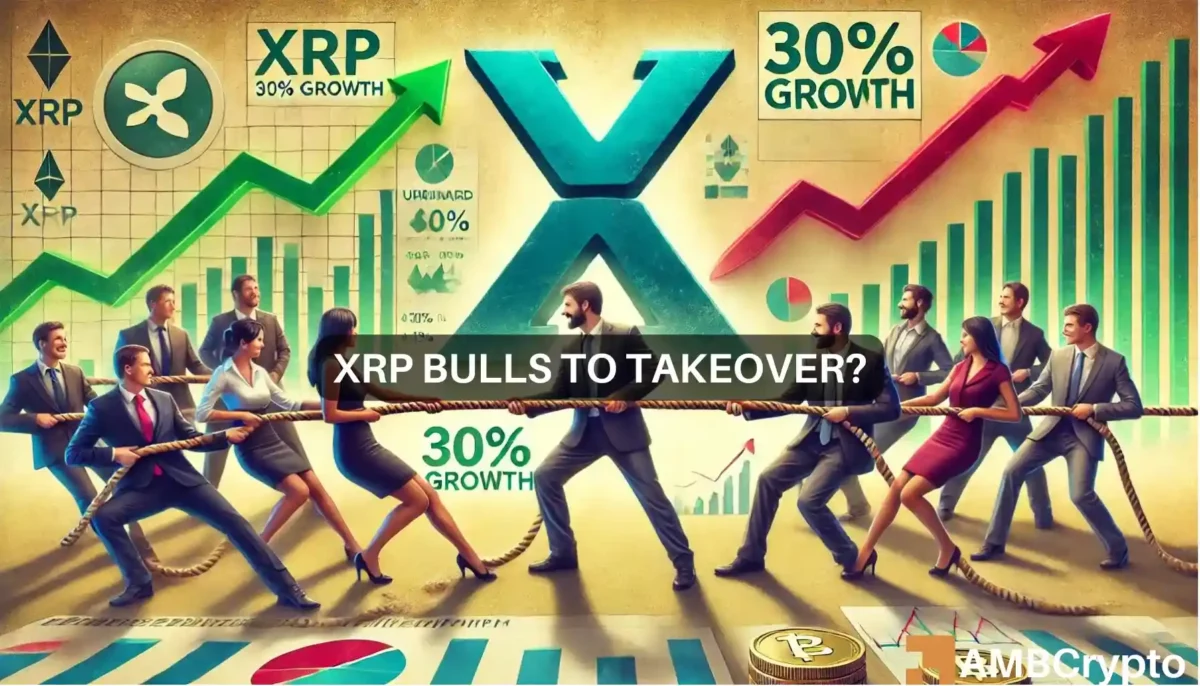
According to the analyst, a successful breakout might result in a 30% to 40% rally in the coming days or weeks.
Is a breakout possible?
Since XRP might be about to break out of the bullish pattern, AMBCrypto analyzed its on-chain data to see whether it supported this possibility. Our analysis of Santiment’s data revealed that investors’ confidence in XRP has been high.
Both the token’s mean coin age of 1 year and 90 days registered massive upticks over the past month. These metrics, together, pointed to a hike in the number of coins that were not moved on the blockchain within the last year and 90 days.
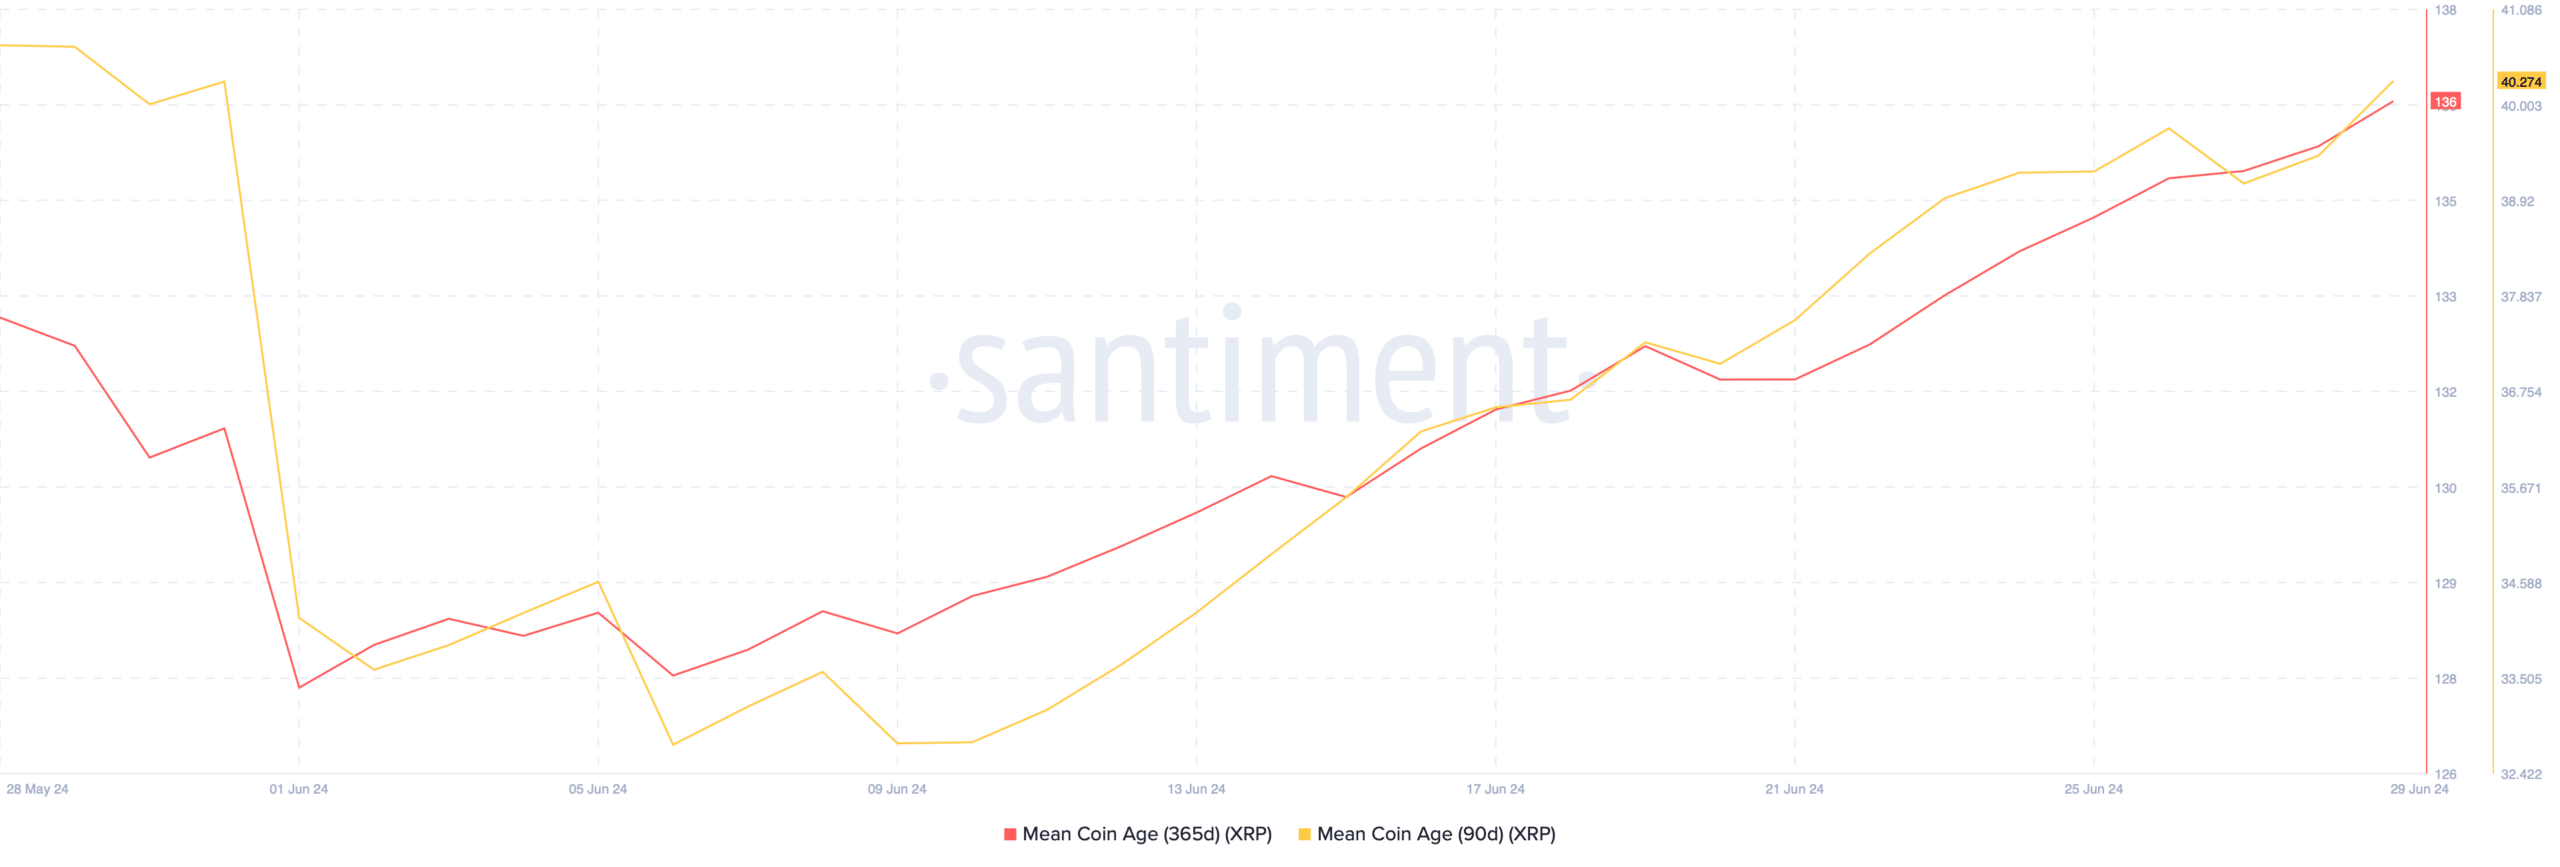
Source: Santiment
AMBCrypto’s analysis of Hyblock Capital’s data also revealed an interesting relationship between XRP’s price and its cumulative liquidation delta.
We found that whenever the token’s cumulative liquidation delta turns green, the token’s price action either slows down or declines. To the contrary, when this metric turns red, it is usually followed by a price hike.
At press time, this metric had a value of -785, hinting at a price uptick on the charts soon.

Source: Hyblock Capital
That being said, a few of the metrics looked bearish. For instance, Coinglass’s data suggested that the token’s long/short ratio dropped – A sign of bearish sentiment rising across the board.
Additionally, its Fear and Greed Index was also in a “greed” phase at press time. Whenever the metric hits that level, it indicates that the chances of a price correction are high.
Is your portfolio green? Check out the XRP Profit Calculator
Nonetheless, the Relative Strength Index (RSI) registered an uptick. The MACD also flashed the possibility of a bullish crossover – More evidence supporting the likelihood of XRP successfully breaking out from the falling wedge pattern.
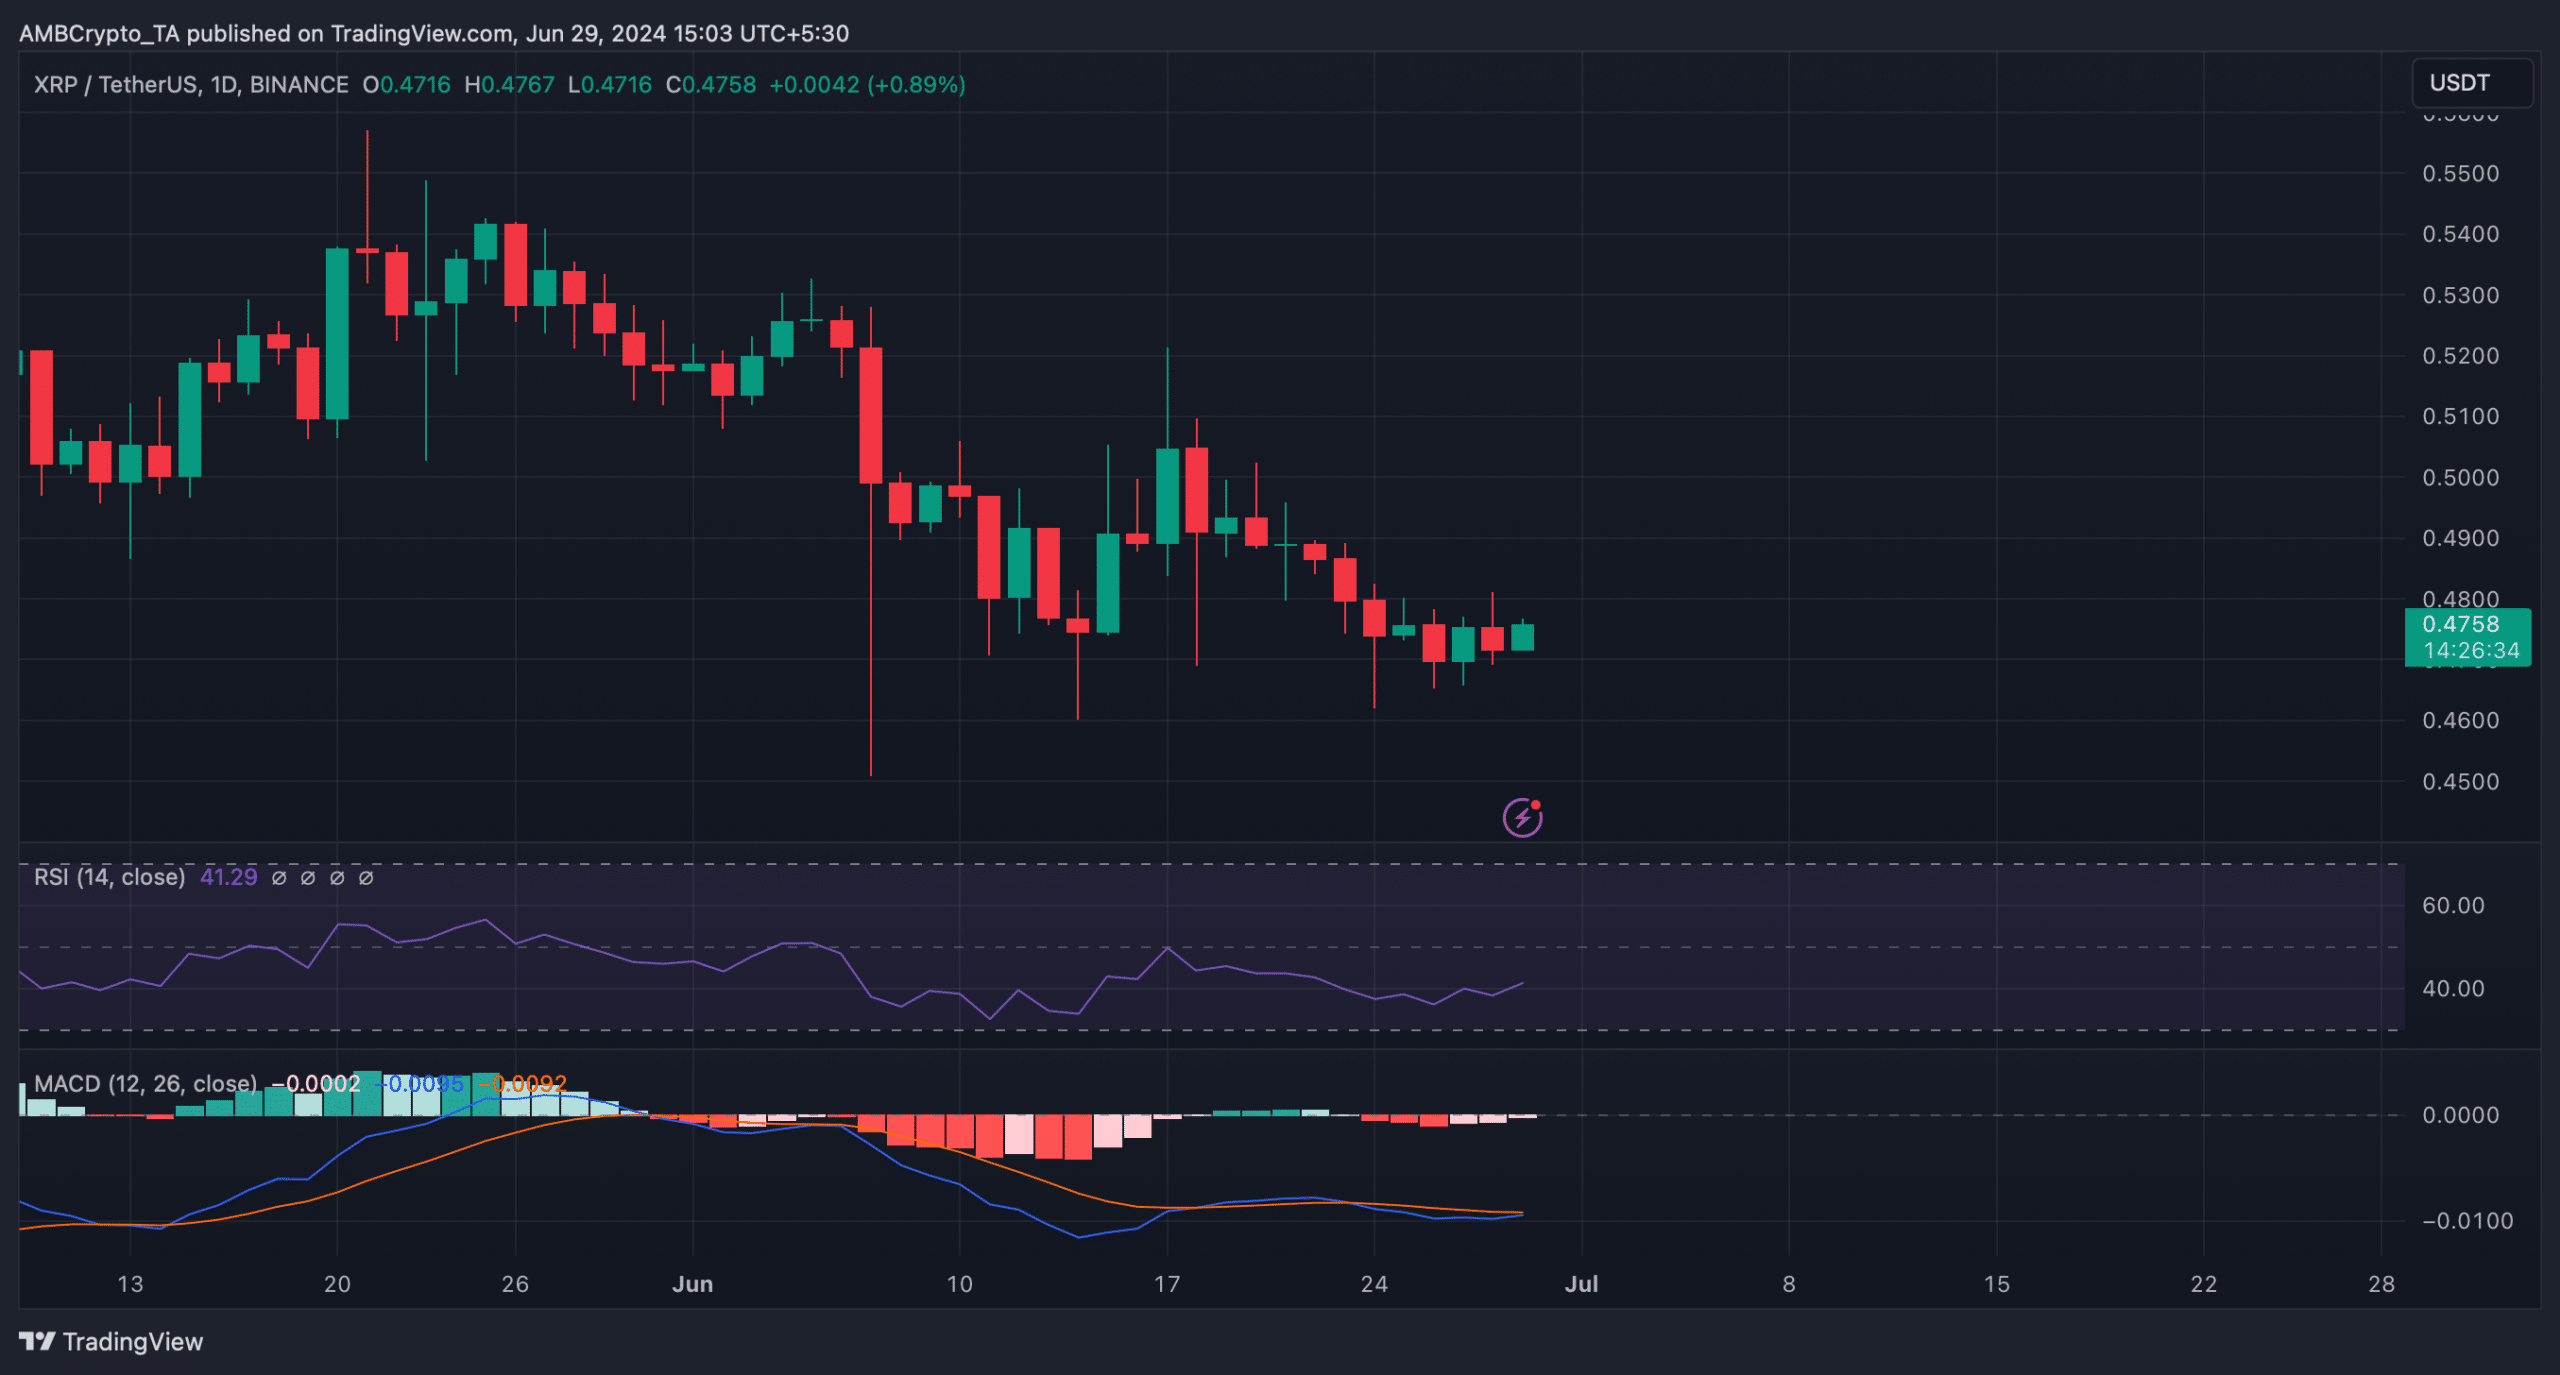
Source: TradingView