
- XRP fell to a two-month low on 7 June
- XRP depreciated after reports claimed Ripple sold some of its XRP holdings
XRP’s price cratered to a two-month low of $0.498 during the trading session on 7 June, according to Santiment’s data. The last time the altcoin was trading at this price level was back on 17 April.
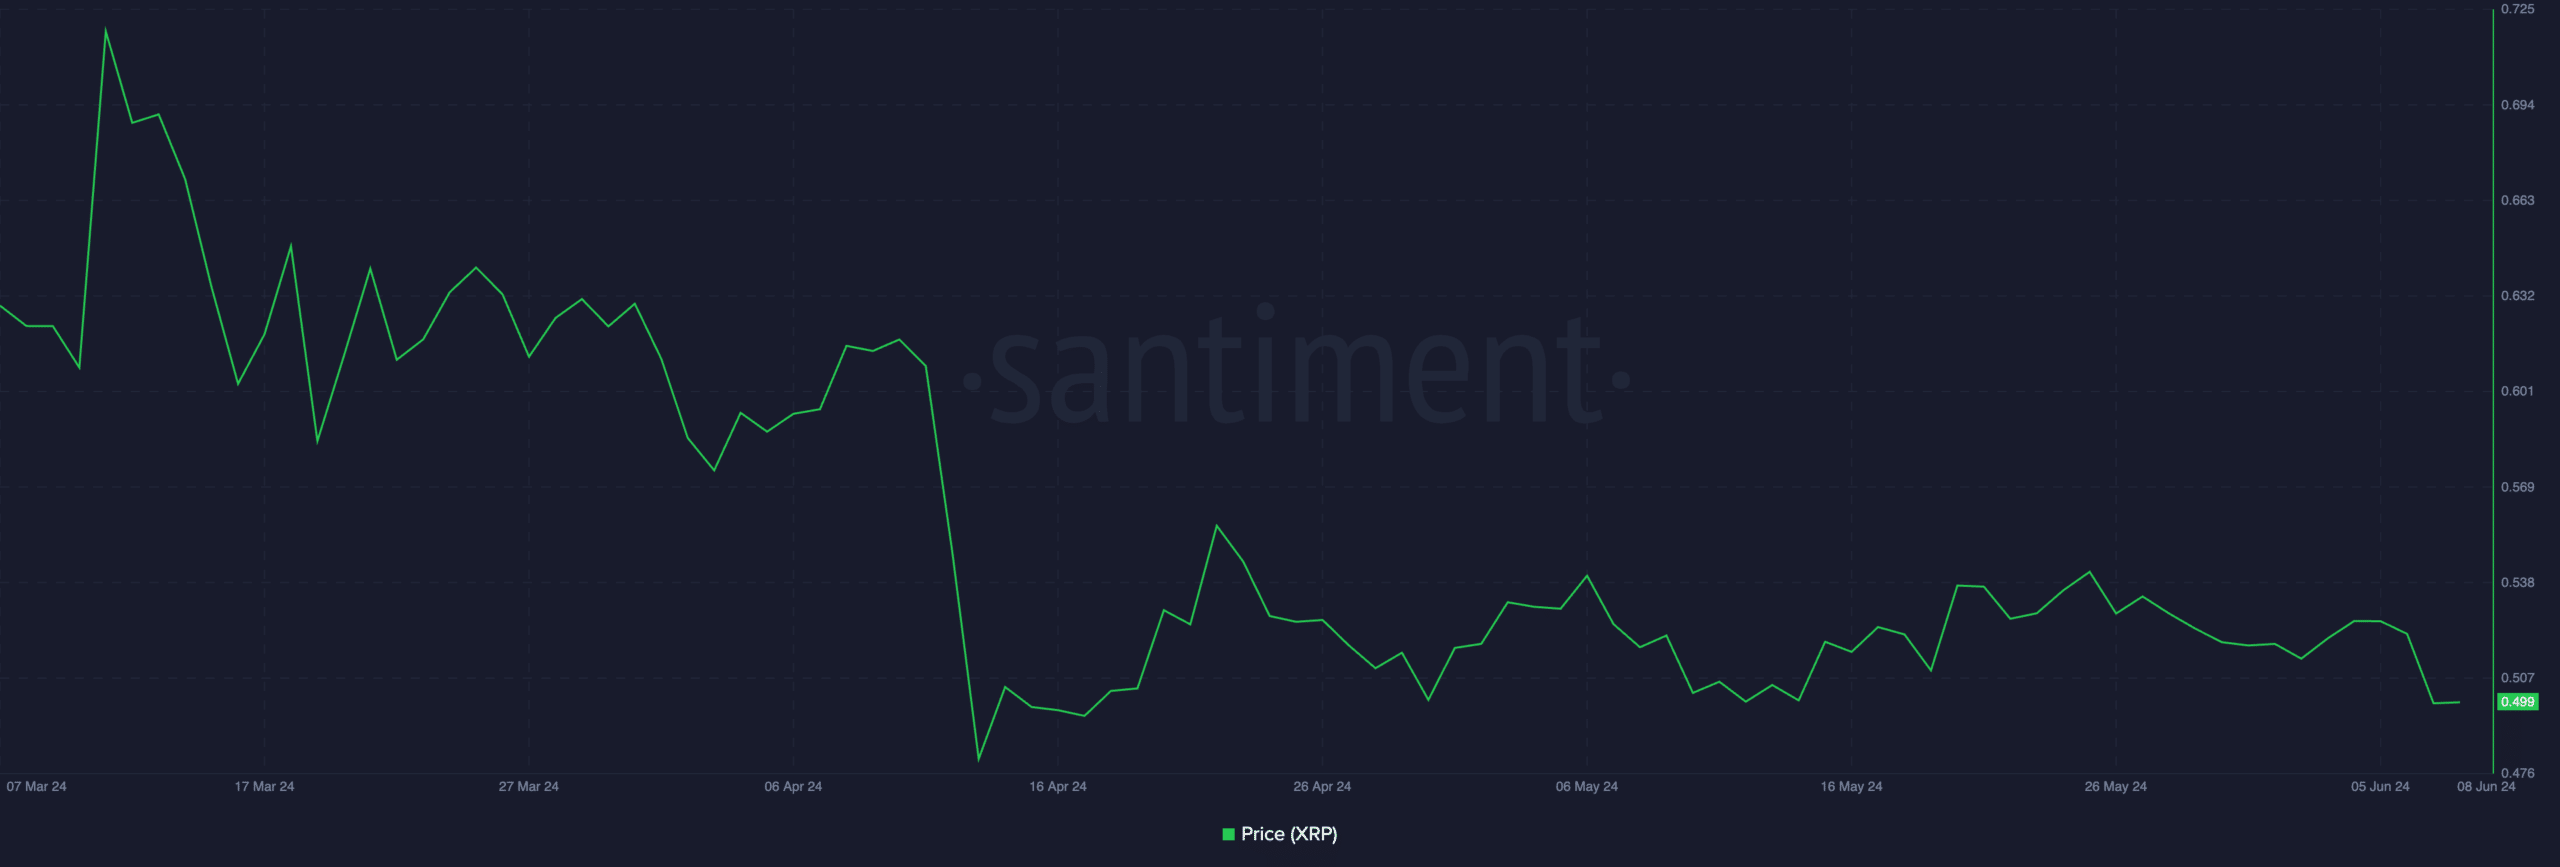
Source: Santiment
This decline was caused by market jitters following reports that Ripple, the token’s developer and largest holder, sold 150 million XRP, valued at $75 million at current market prices, on that day.
With significant selling activity ongoing at press time, XRP’s sales volume was up 104% in the past 24 hours. This formed a bearish divergence with the token’s price, which logged a 4% price decline during that period.
When an asset’s daily trading volume surges while its price falls, this is a bearish signal. It suggests that more market participants are selling the asset.
XRP ready to take more losses
AMBCrypto’s assessment of XRP’s price performance on the one-day chart revealed that the altcoin is poised for a further downtrend in the short term.
XRP’s price decline in the past 24 hours has pushed its price below its 20-day Exponential Moving Average (EMA).
An asset’s 20-day EMA tracks its average price over the last 20 days. When the price falls under this key moving average, it signals a spike in selling pressure, suggesting that the bulls are losing market control.
Confirming the surge in selling pressure, XRP’s key momentum indicators trended downwards and were positioned below their respective 50-neutral lines at press time. For example, XRP’s Relative Strength Index (RSI) was 37.97, while its Money Flow Index (MFI) was 32.29.
At these values, the indicators showed that the token’s traders preferred XRP distribution over its accumulation.
Read Ripple’s [XRP] Price Prediction 2024-25
Furthermore, XRP’s Aroon Down Line (blue) was 92.86%. An asset’s Aroon indicator identifies its price trend strength and potential reversal points. When the Aroon Down line is close to 100, it indicates that the downtrend is strong and that the most recent low was reached relatively recently.
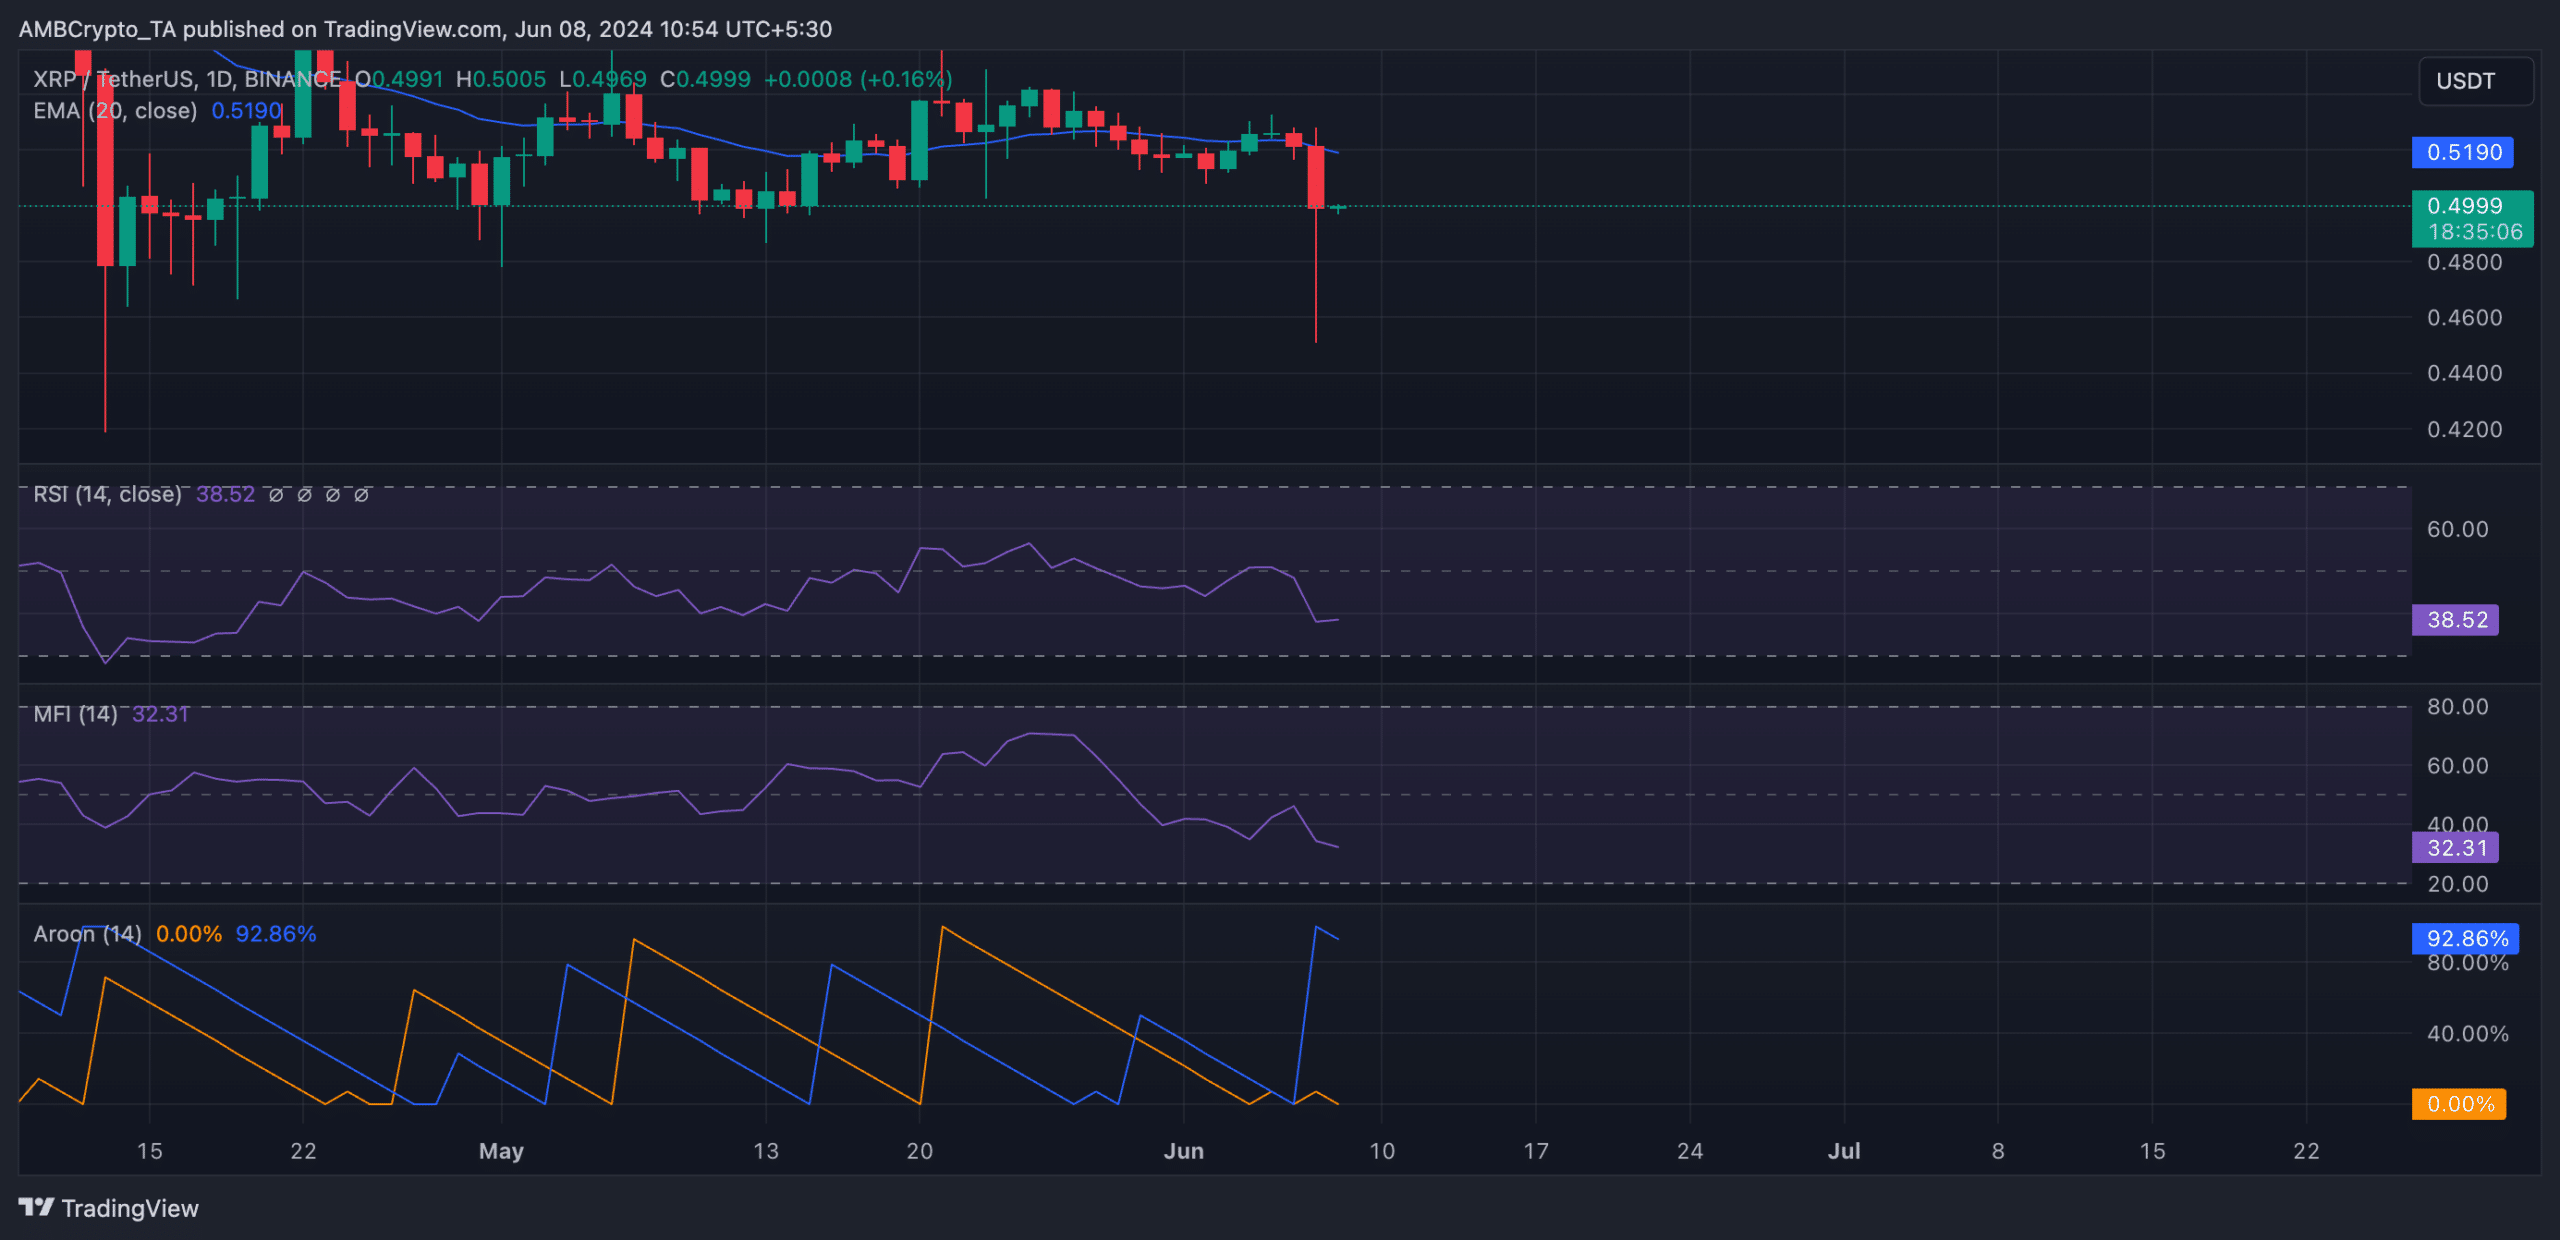
Source: XRP/USDT on TradingView
If selling pressure continues to mount, XRP’s price may dip to $0.491. If the bulls fail to support this level, XRP’s value may drop below the $0.49-level to trade at $0.481.
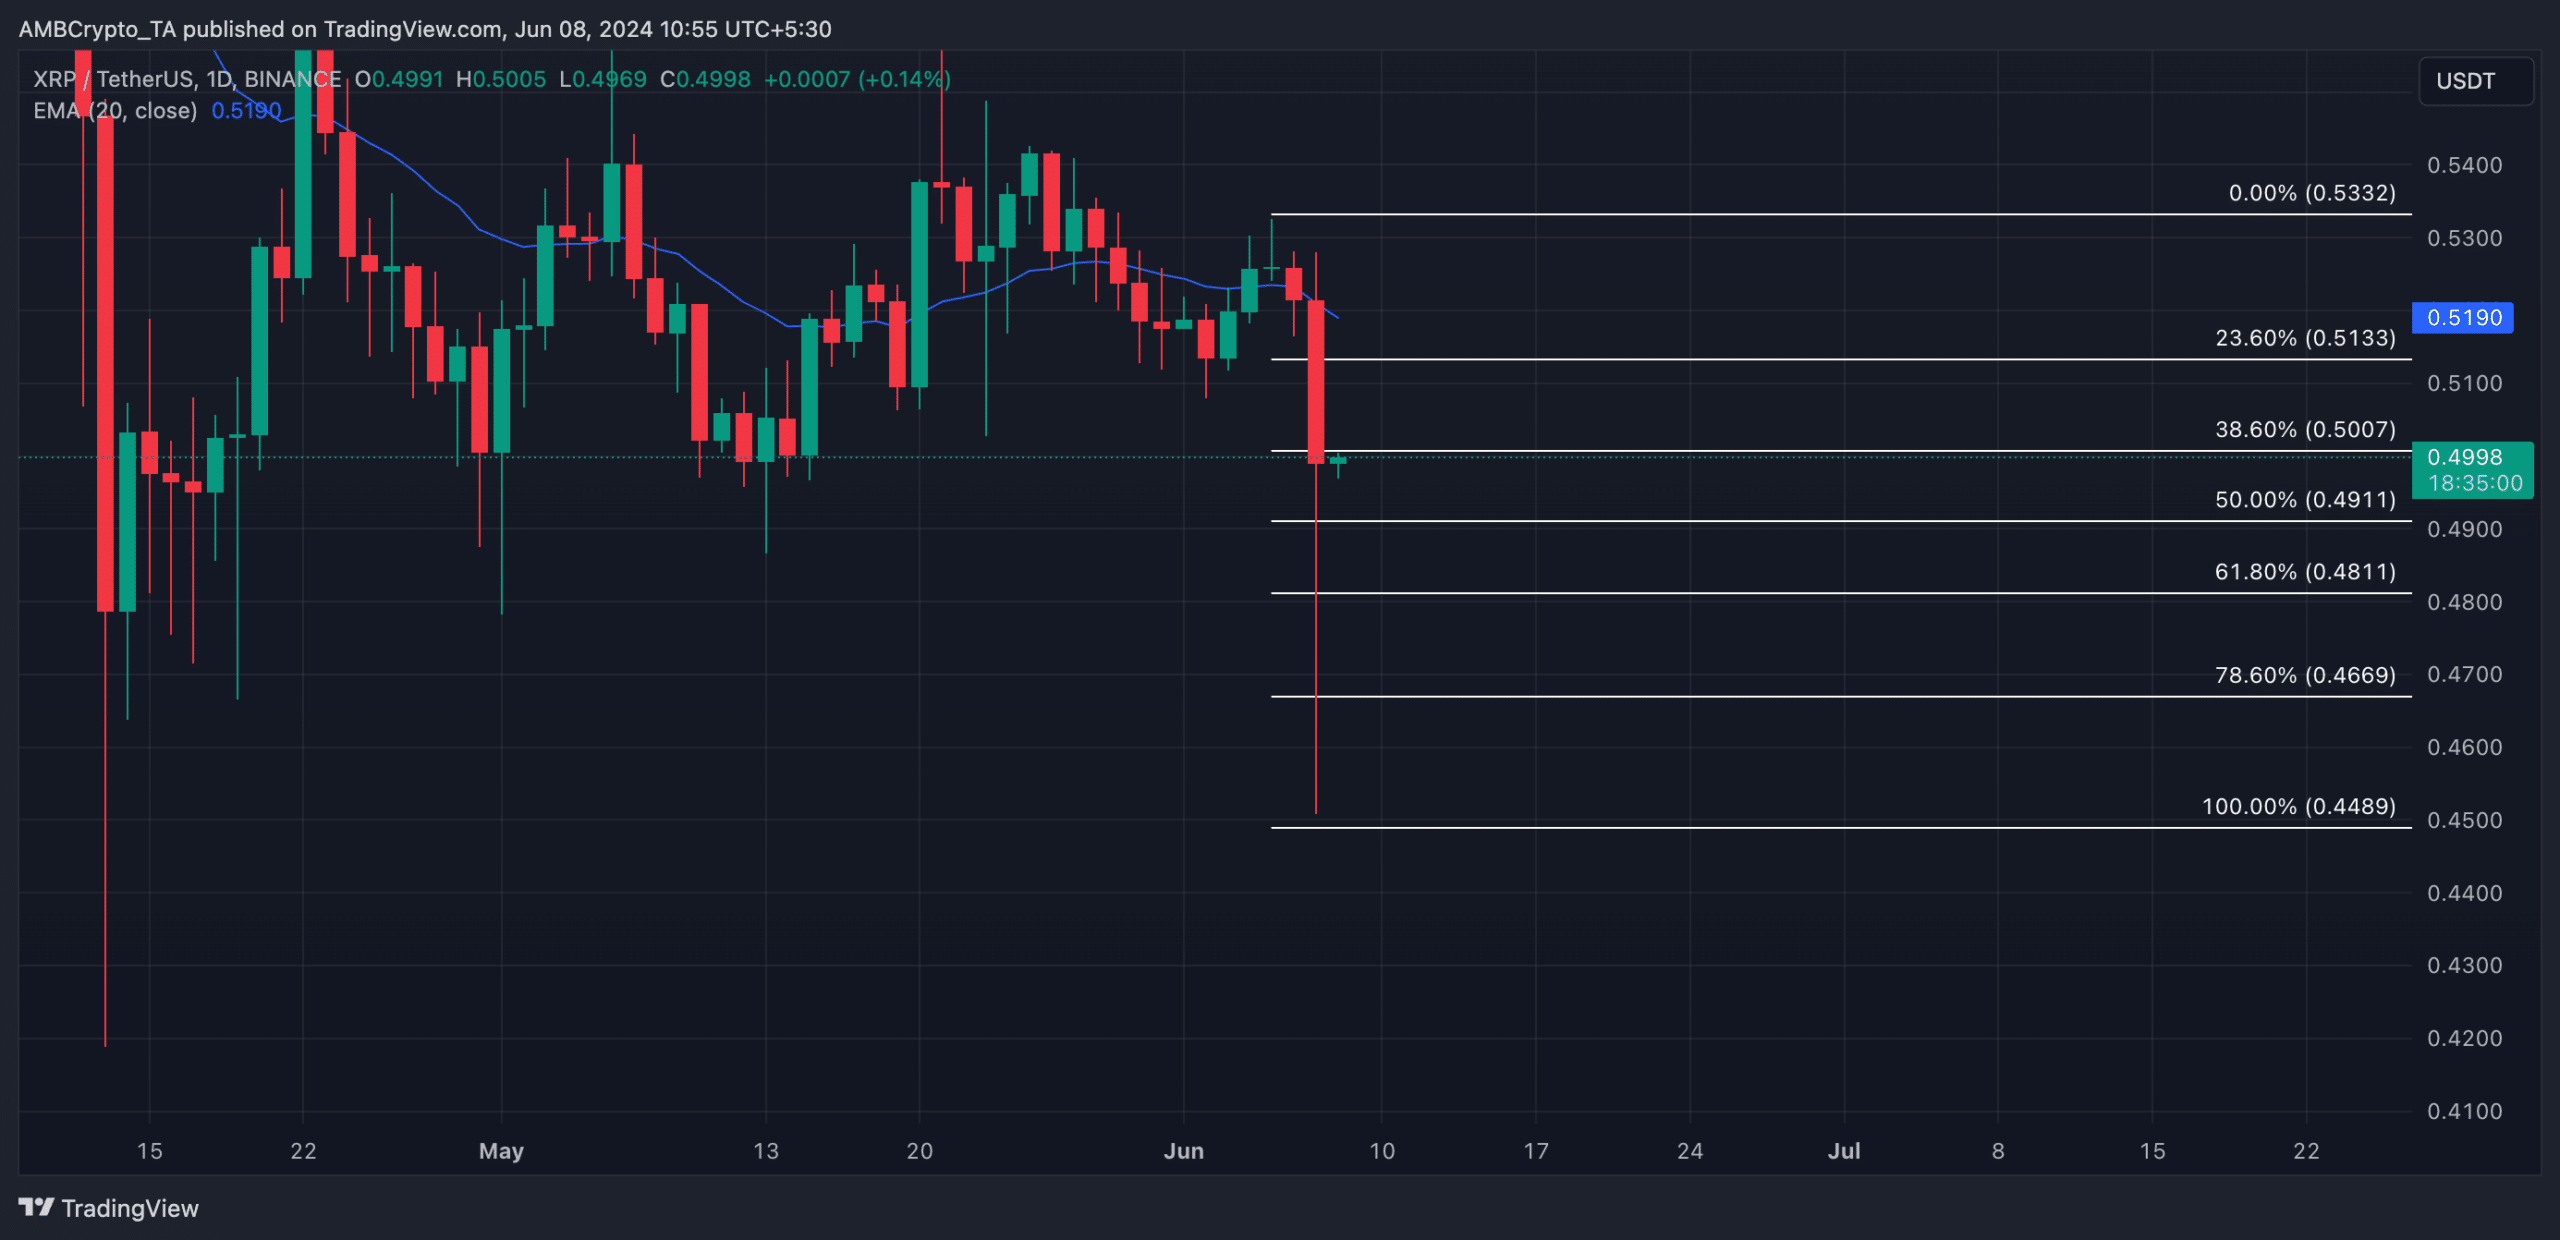
Source: XRP/USDT on TradingView
However, if this projection is invalidated and the bulls regain market control, they may push the token’s price to $0.5.