XRP’s price hits bullish target, but here’s why the next sell-off might not be far
The recent XRP rejection from just below $1.30 can spark another sell-off.

XRP has had a relatively quiet 24 hours of trading. It was above the $1.18-local resistance level, but has only moved by 0.21% since. This, despite its daily trading volume shrinking by 44%.
Spot XRP ETF flows have been positive for the most part this month. The bounce from $1.14 to $1.29 last weekend has begun to wane though, and the price is once again struggling to stay afloat above the $1.21 local support.
AMBCrypto reported concentrated demand in the South Korean exchange Upbit during the recent price move higher. Since the demand wasn’t reflected evenly across other exchanges, it did not allude to a sustained recovery being underway for XRP.
XRP achieves bullish breakout target
However, in a post on X, crypto analyst Ali Martinez pointed out that a symmetrical triangle formation was underway.
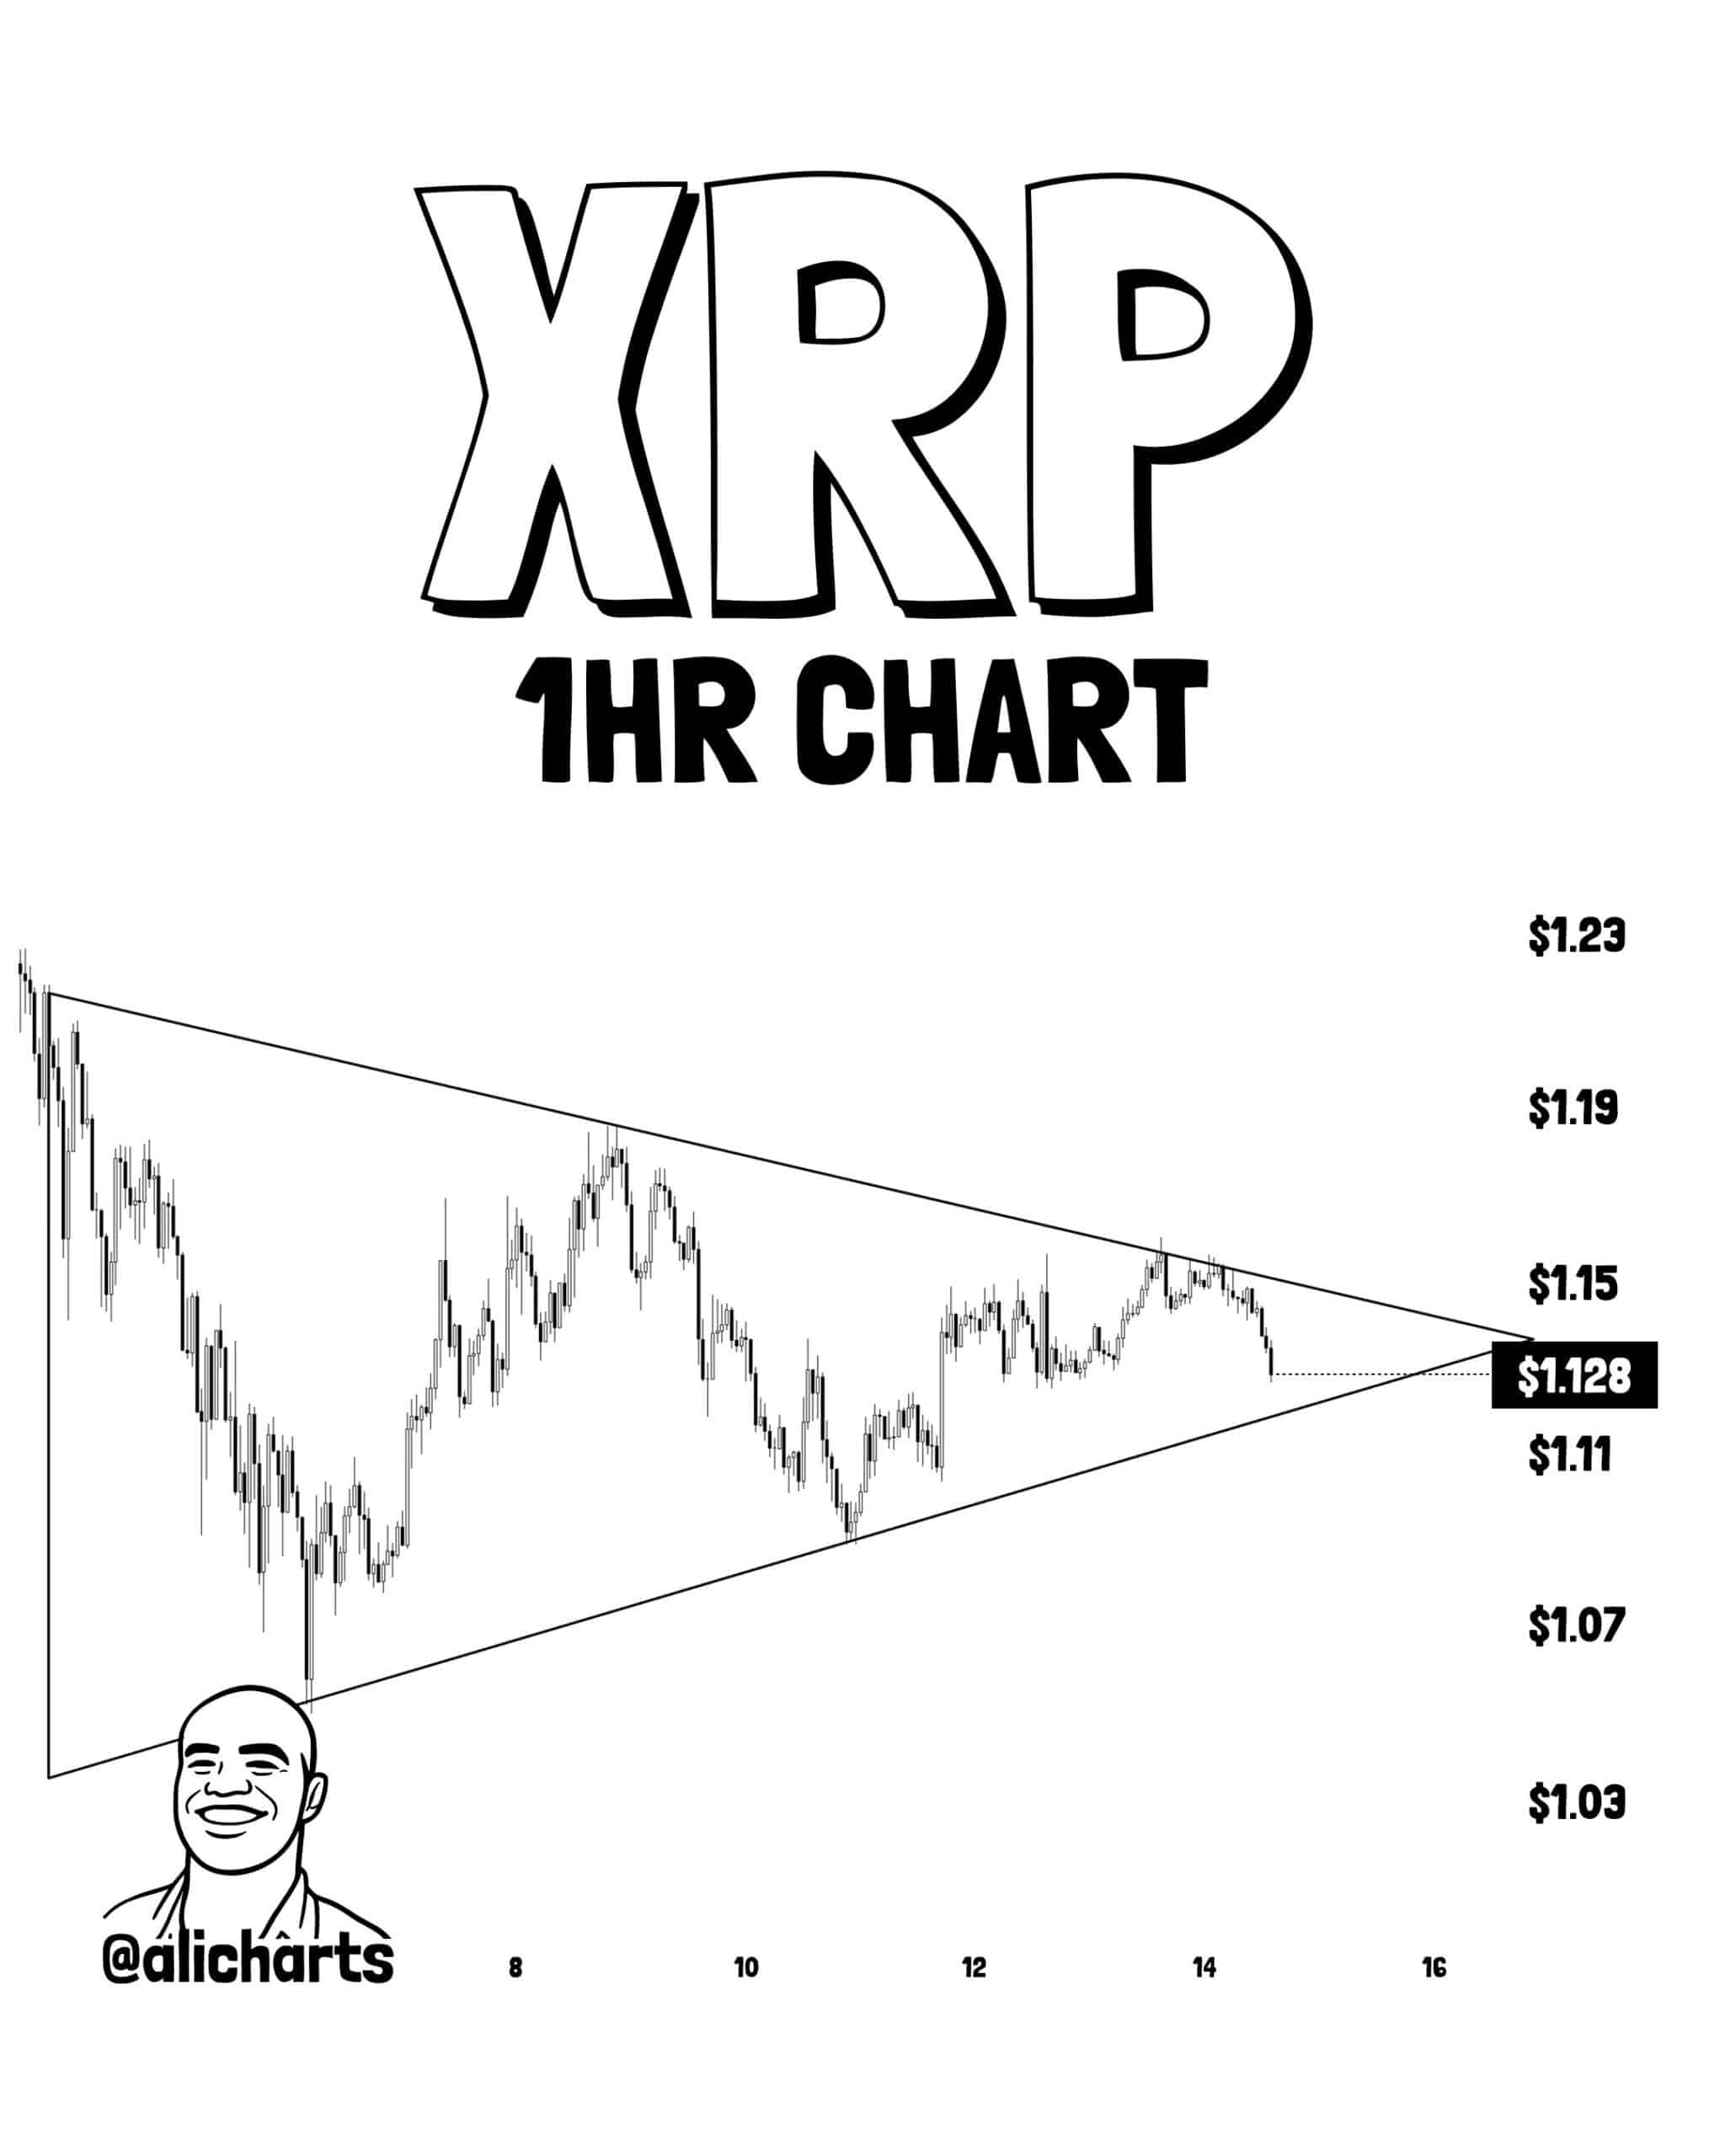
This pattern was projected to have a 14% breakout target, and it did nearly reach the $1.30 target before retracing.
At the time of writing, the lower timeframe had shifted from bullish to neutral too.
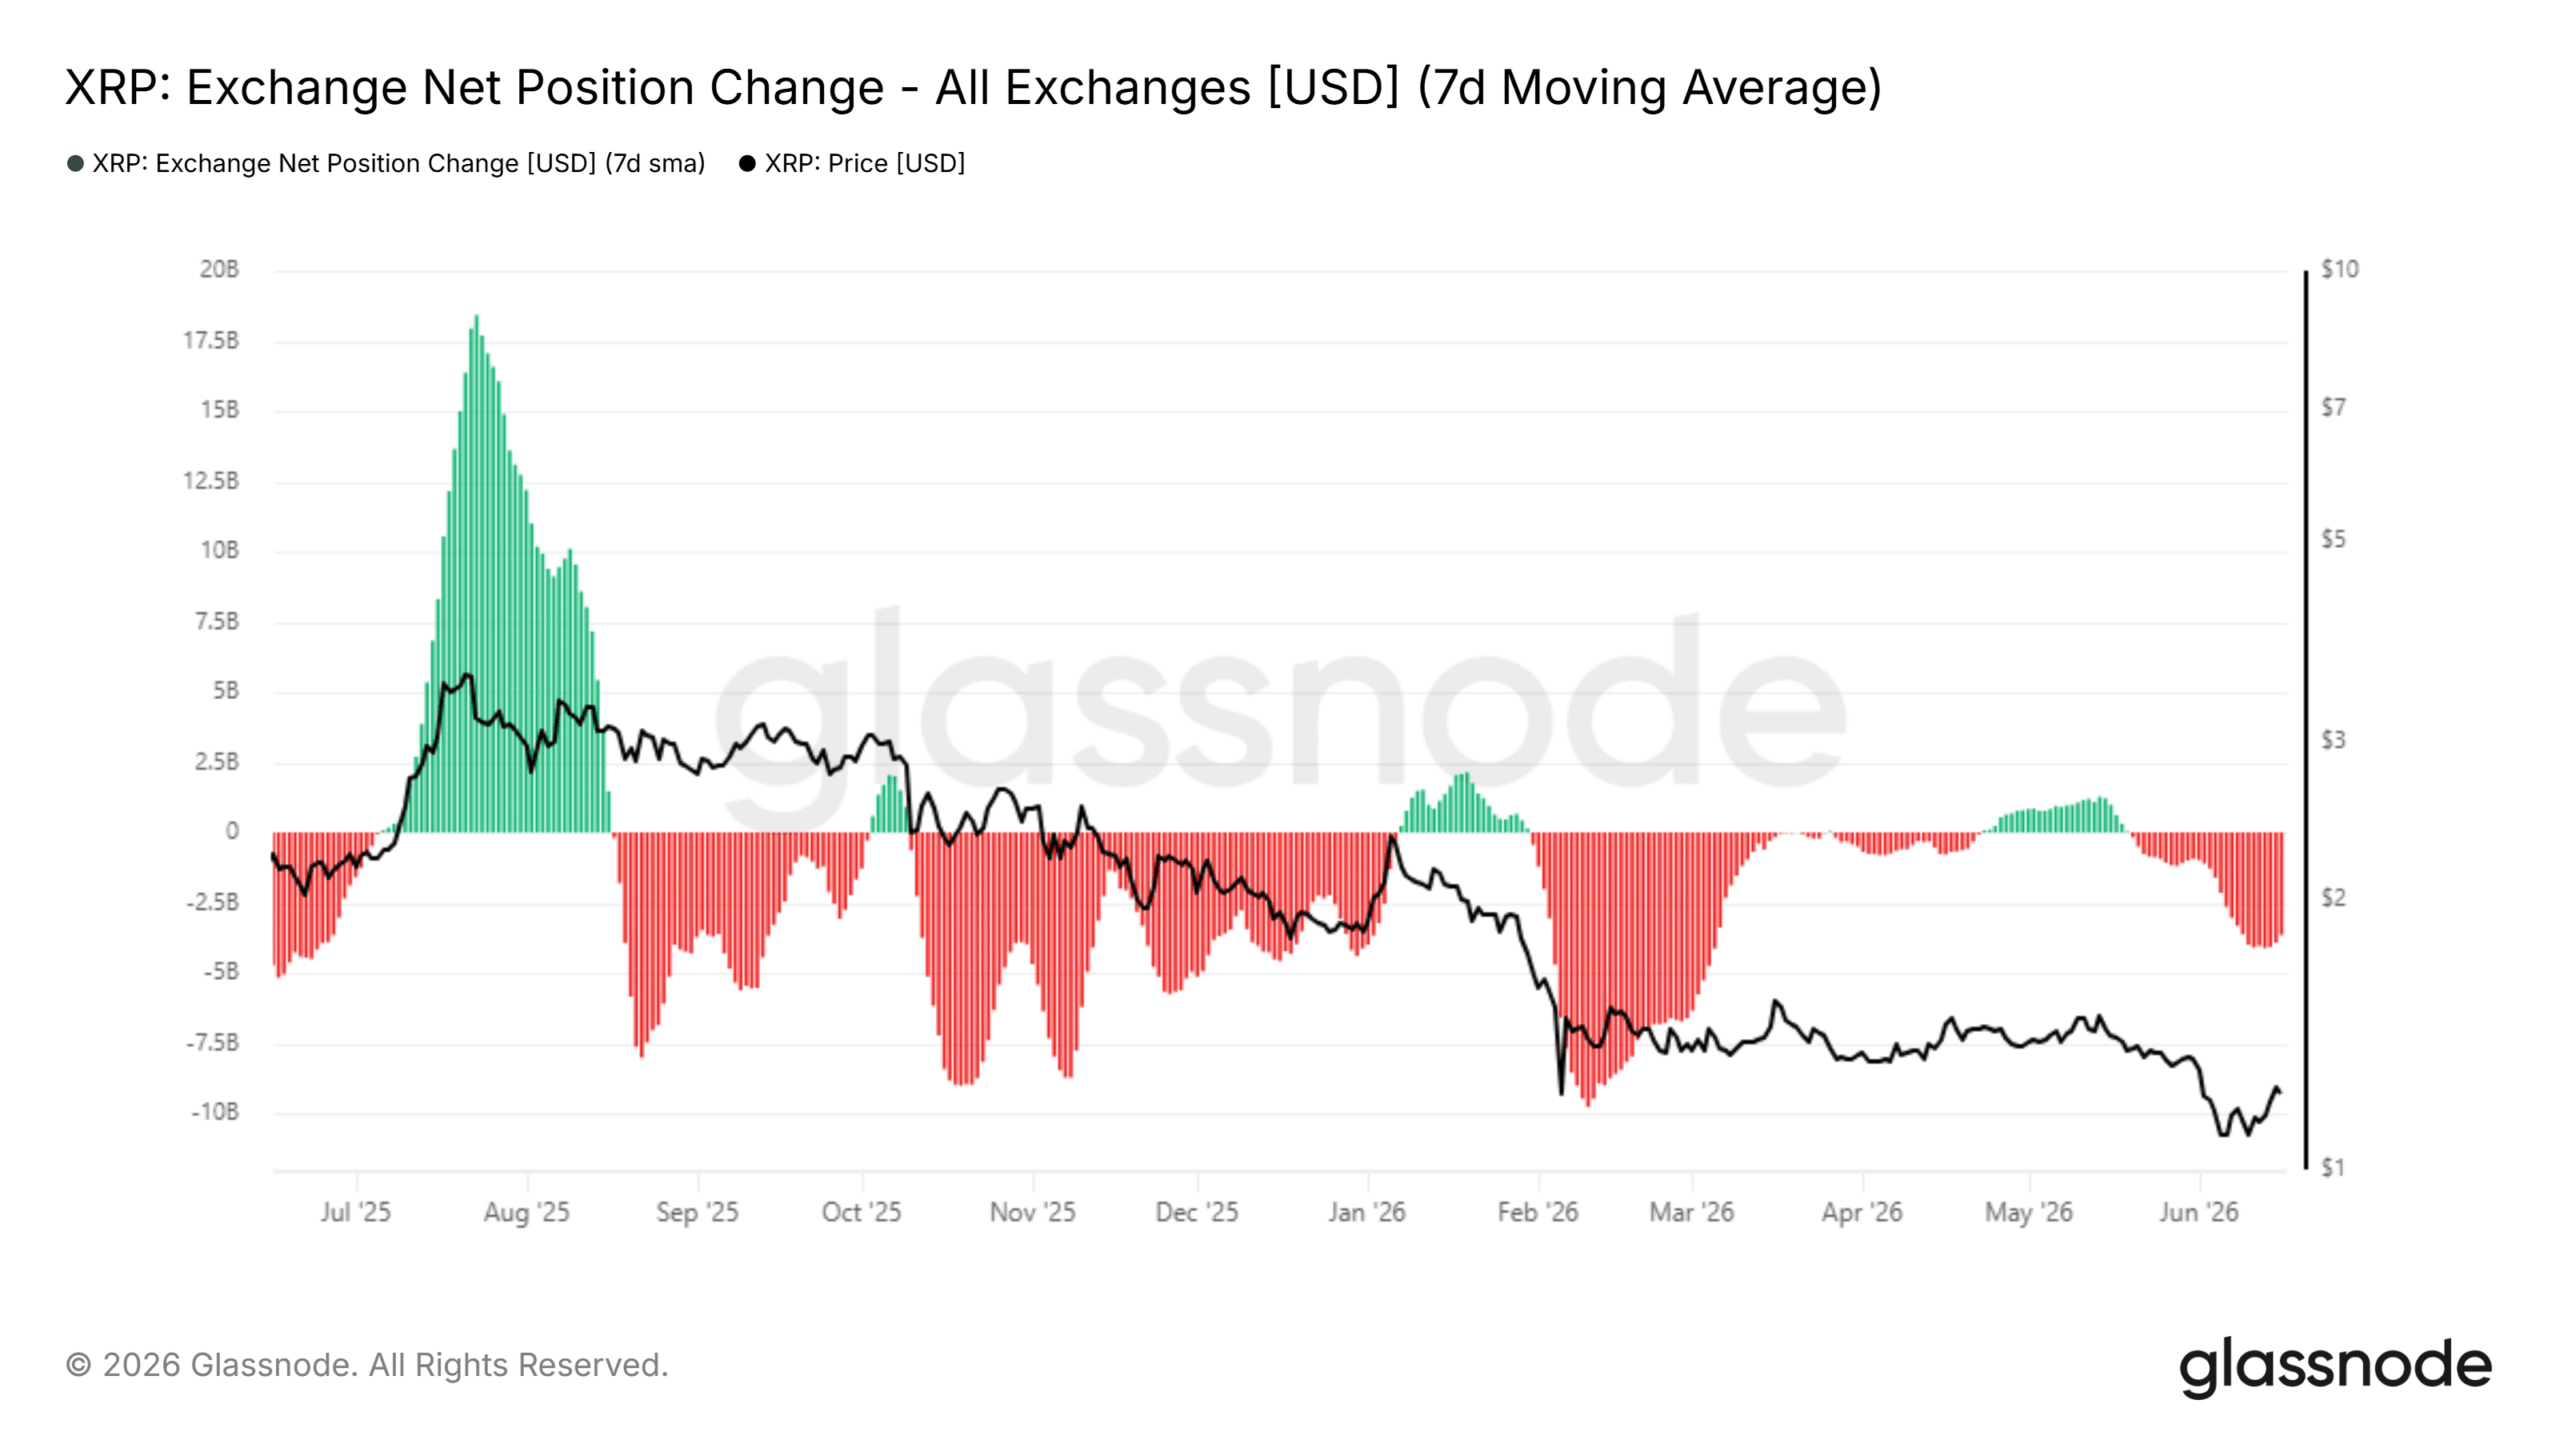
That’s not all either as the 7-day moving average of the exchange net position change became increasingly negative over the past three weeks. This meant XRP was flowing out of exchange wallets, reflecting accumulation.
By itself, it does not guarantee a price trend. In February, the massive sell-off was followed by rapid accumulation, but the price of XRP did not enter another uptrend.
Instead, it formed a range before continuing its descent.
XRP’s price action continues to favor a bearish bias
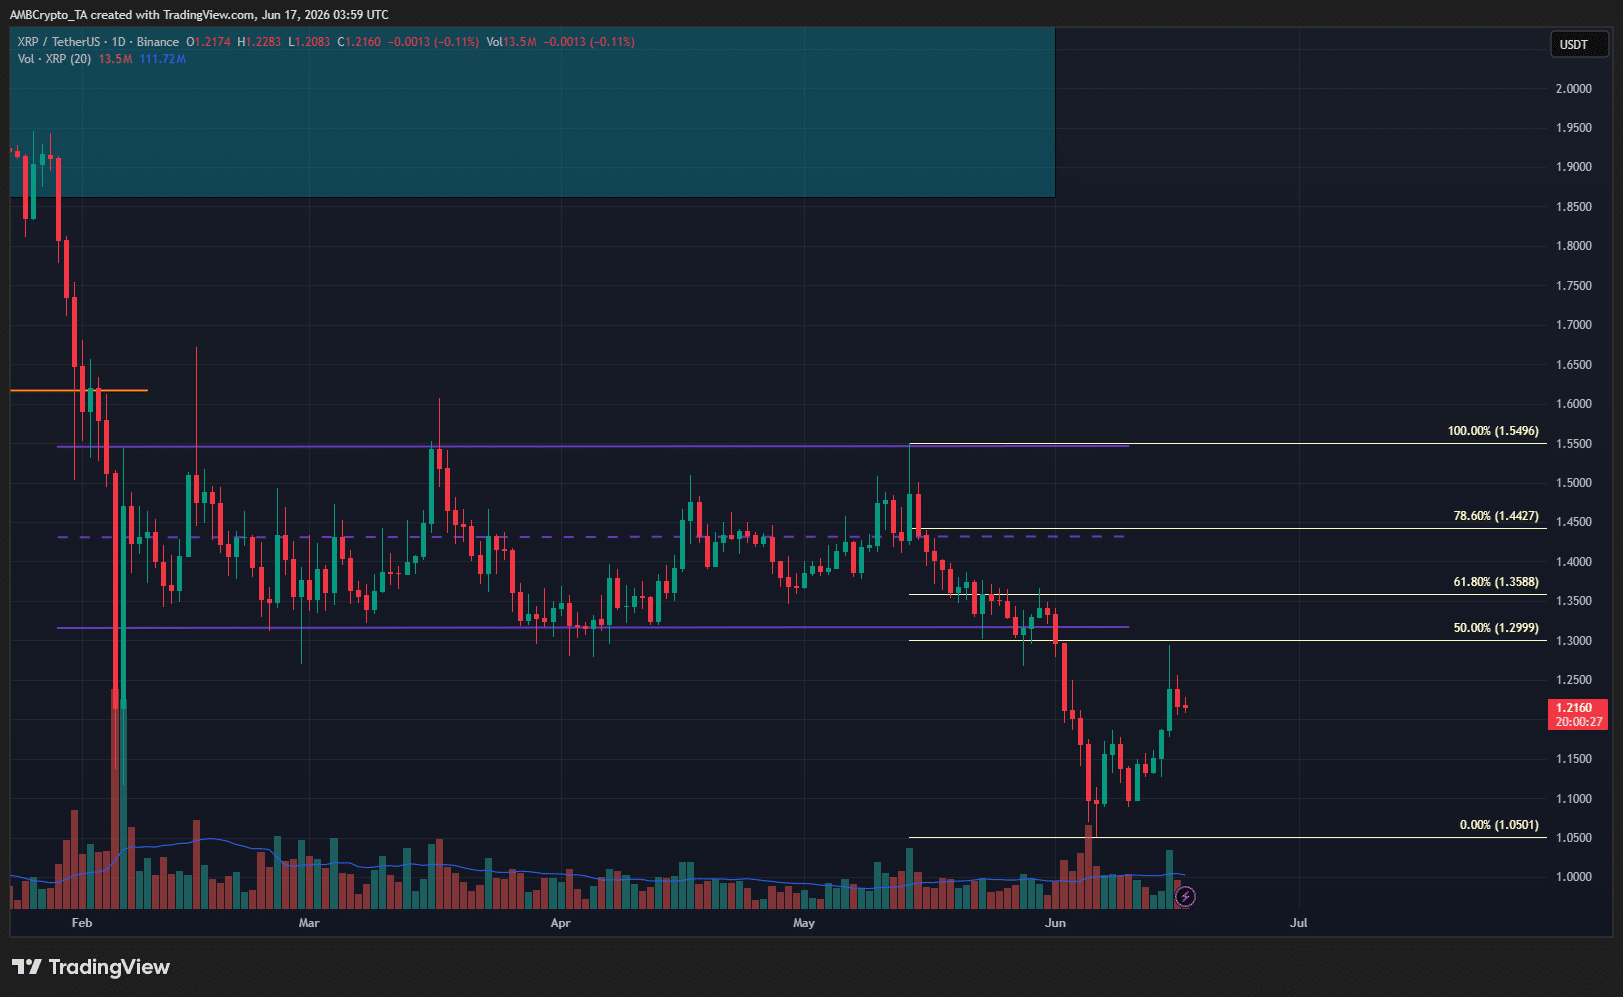
The breakdown from the range made a bearish structural break. The bounce over the past two weeks was barely able to reach the 50% retracement level before declining to $1.21, at the time of writing.
The risk-to-reward was not favorable for swing buyers. Traders can use a bounce to $1.35-$1.44 to sell, targeting a breakdown below $1.05.
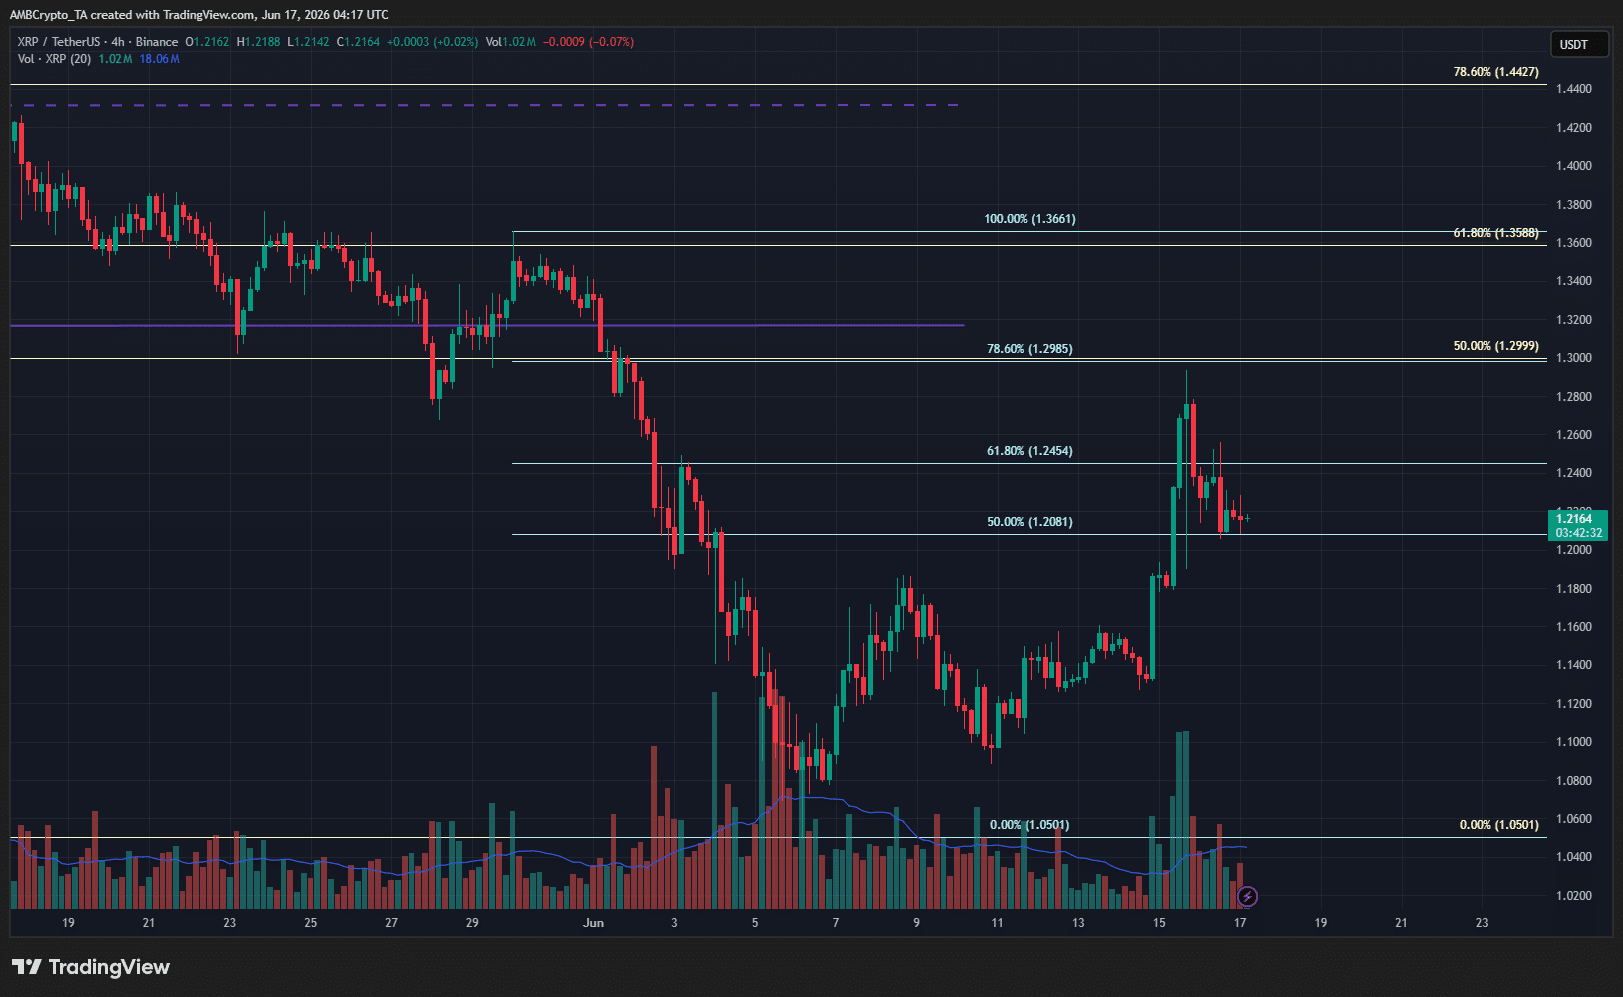
The 4-hour chart revealed that the bearish move might already be underway. The altcoin has faced rejection from the H4 78.6% retracement level at $1.298. A drop below $1.208 would reinforce short-term bearish momentum.
Final Summary
- XRP Spot ETF flows and accumulation trends on-chain might not be enough to orchestrate a recovery.
- Longer-term price trend has been bearish and the recent rejection from just below $1.30 can spark another sell-off.