XRP’s price remains bearish at short term but bulls appear on the horizon
Since breaching the $0.42539 support in late June, XRP has been on a downward trend with a current valuation around $0.25784. The recorded market cap at press time was around $11 billion and the 24h volume was over $1.05 billion, having experienced a 1.38% decrease in the last day.
1-hour chart
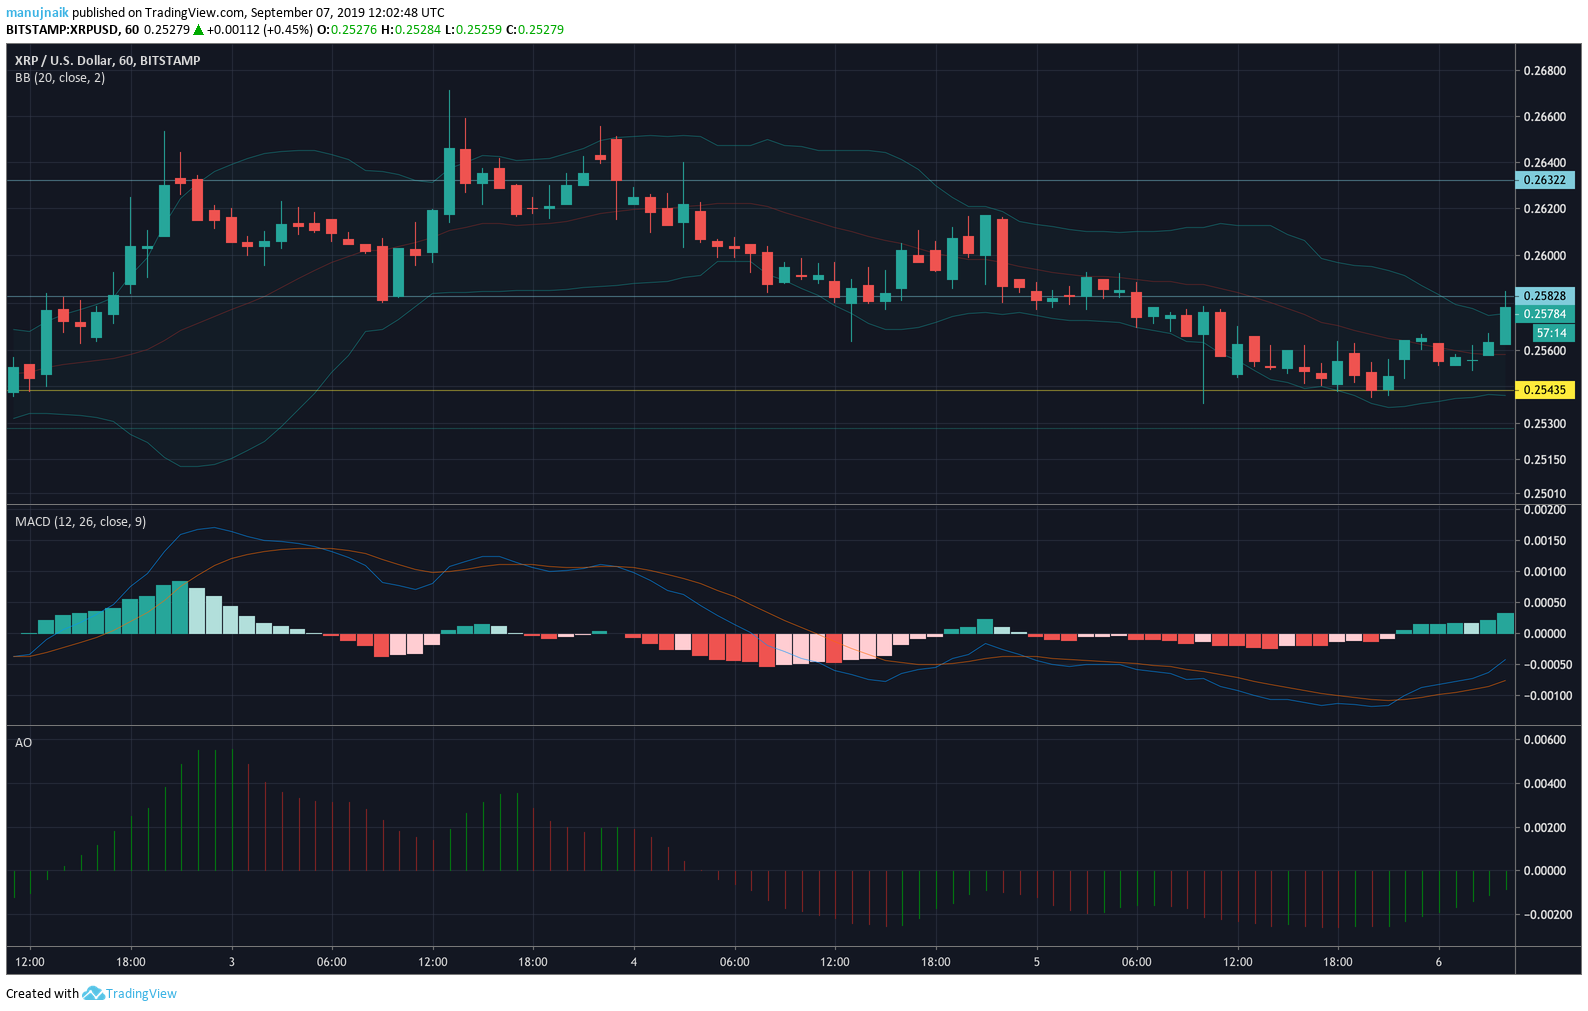

Resistance 1: $0.25828
Resistance 2: $0.6322
Support 1: $0.25435
The short term chart of XRP witnessed a slight downtrend which stretched the valuation from $0.26499 to $0.25435.
Awesome Oscillator exhibited the appearance of green with decreasing bullish momentum.
The MACD line remained bearish on the short term as the blue line crossed over the red line into a downwards trend.
The converging of the Bollinger Bands show that price volatility is lowering.
1-day chart
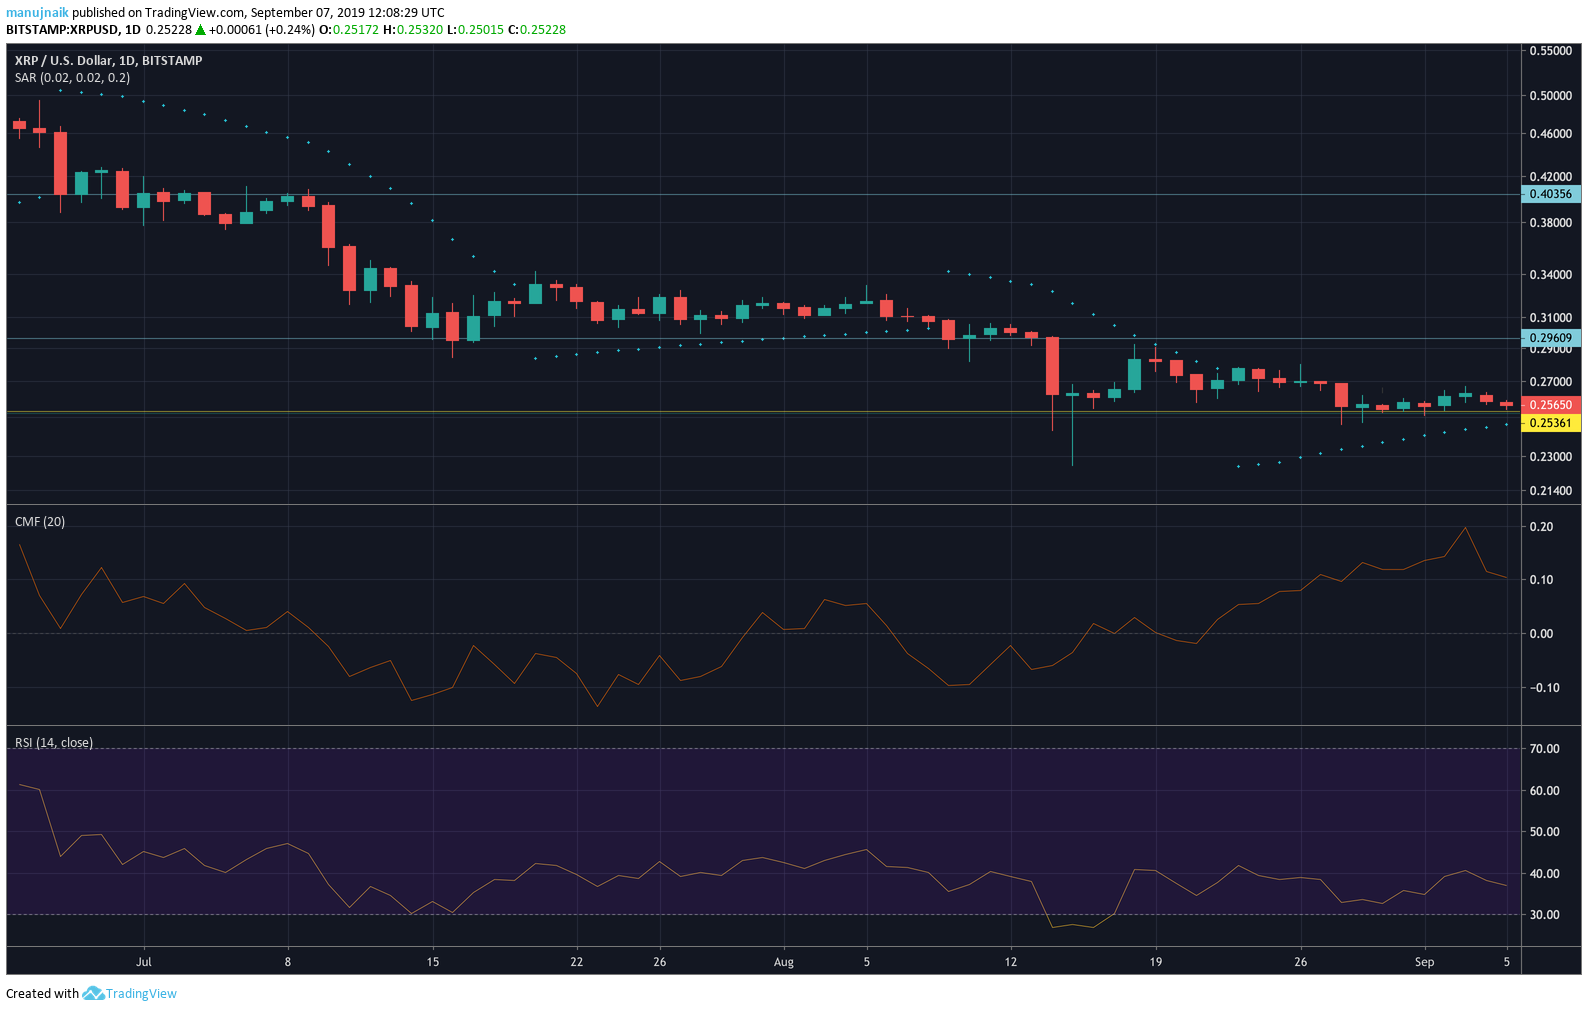
Resistance 1: $0.29609
Resistance 2: $0.40356
Support 1: $0.25361
The long term chart indicated that the price of XRP had been oscillating between Resistance 1 and Support 1 for almost three weeks. After it breached Resistance 1 in mid-August, the price attained sideways movement without any resistance breach.
Parabolic SAR suggests a bullish short-term as it moves under the candles.
Chaikin Money Flow (CMF) indicated higher capital in-flow than out-flow, suggesting possible bullishness.
RSI or Relative Strength Index indicates neither oversold nor overbought, oscillating between the 40 and 30 point markers.
Conclusion
XRP looks to be bearish in the short-term and the long-term charts indicate lower volatility and possible bullish movement.