Zcash: Will it break the market structure to allow for a buying opportunity at this level

Disclaimer: The findings of the following analysis are the sole opinions of the writer and should not be considered investment advice
One of the largest privacy coins in the ecosystem, Zcash appeared to experience a revival in interest as prices soared in the past few days. The number of active addresses on the chain nearly tripled from an average of 30k in the past month to 81k at the time of writing.
The transaction volume on the network amounted to $227 million, in comparison Ethereum had a 24-hour volume worth $6 billion. Can the break in market structure on the charts see further gains for Zcash?
ZEC- 1D
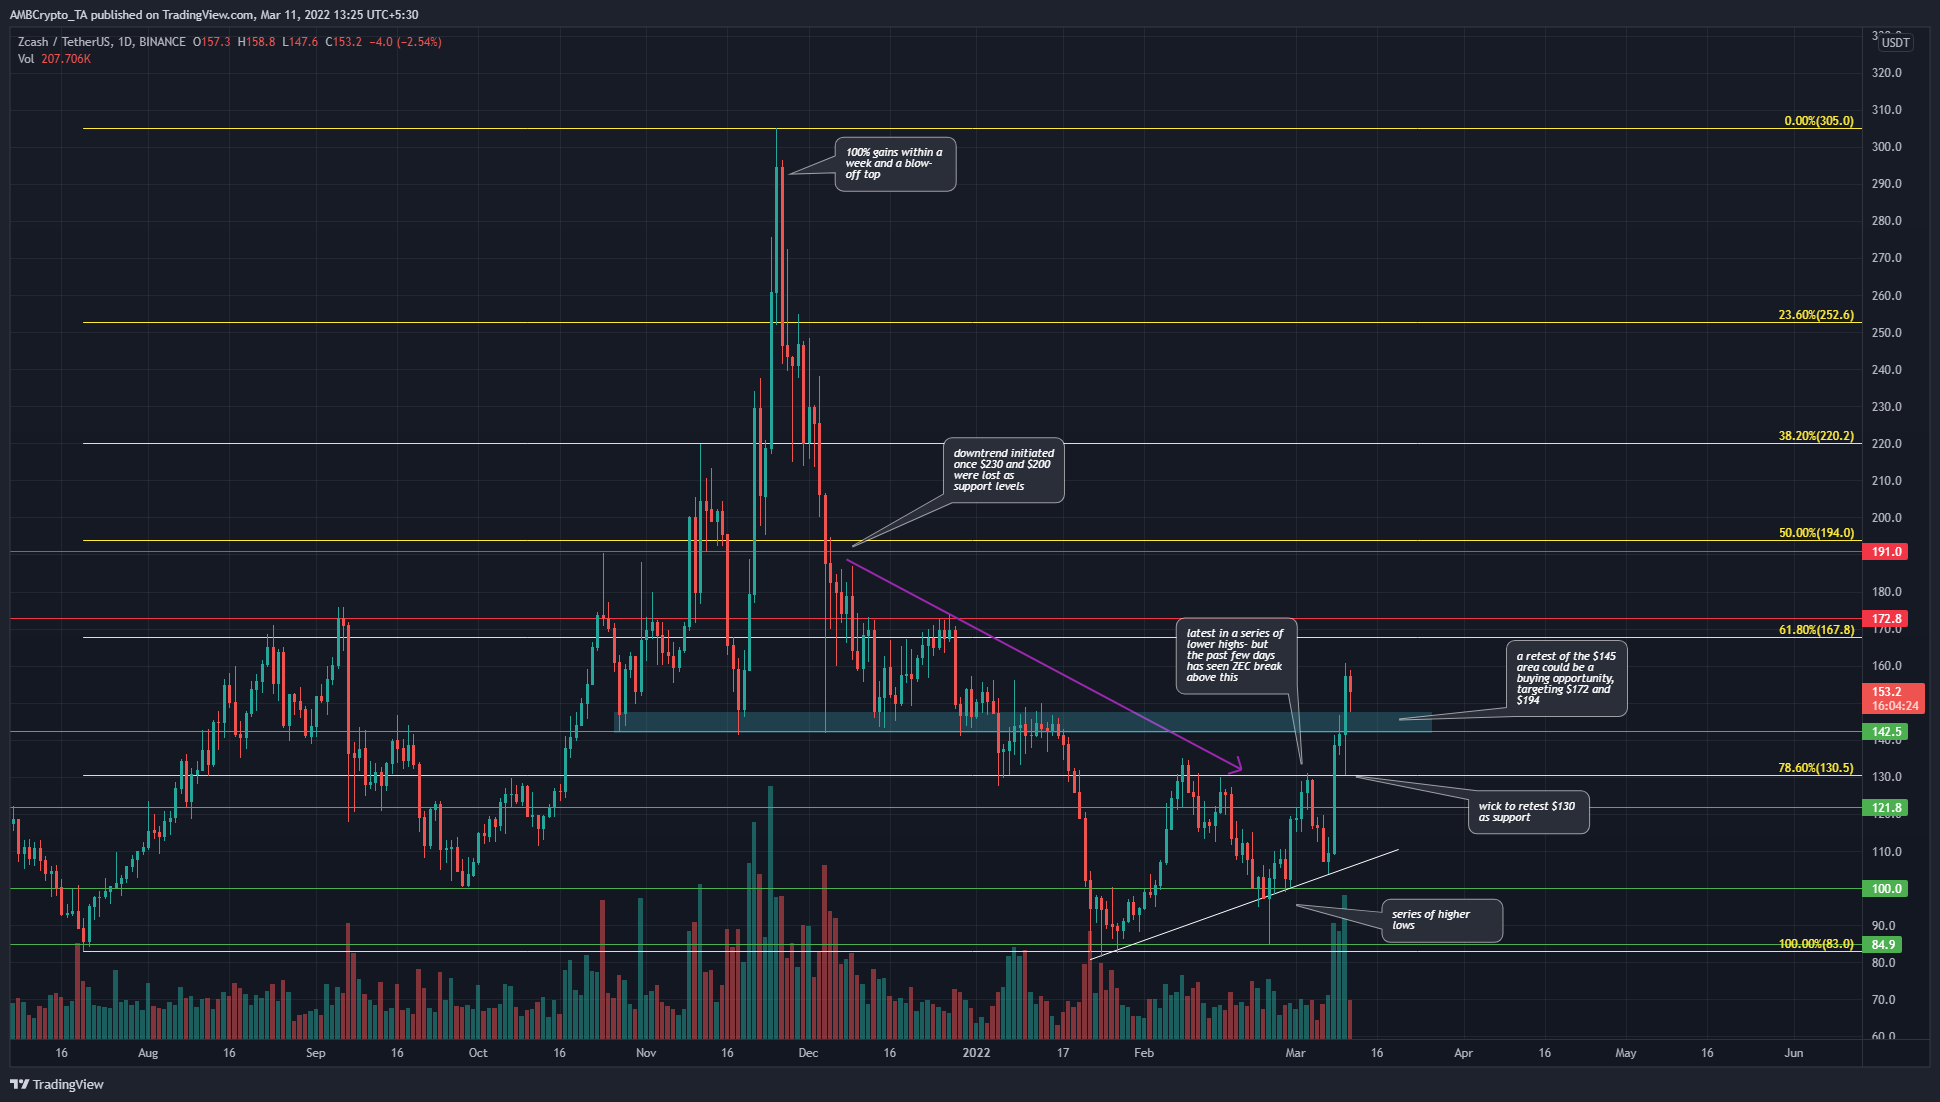
Since early December and slightly earlier, ZEC has been on a downtrend on the daily timeframe. However, in the past two months, the price has made a series of higher lows. At the same time, it has been unable to climb past the $130 resistance- until very recently.
At press time, the price climbed past $142 as well and looked to have flipped it to support. The market structure was now bullish- higher lows had been formed and the most recent lower high of the downtrend has also been breached.
Therefore, a retest of the $142 area (cyan box) could be a buying opportunity. This buy would target $172 and $190 as take-profit levels. A close below $142 would invalidate this scenario.
Rationale
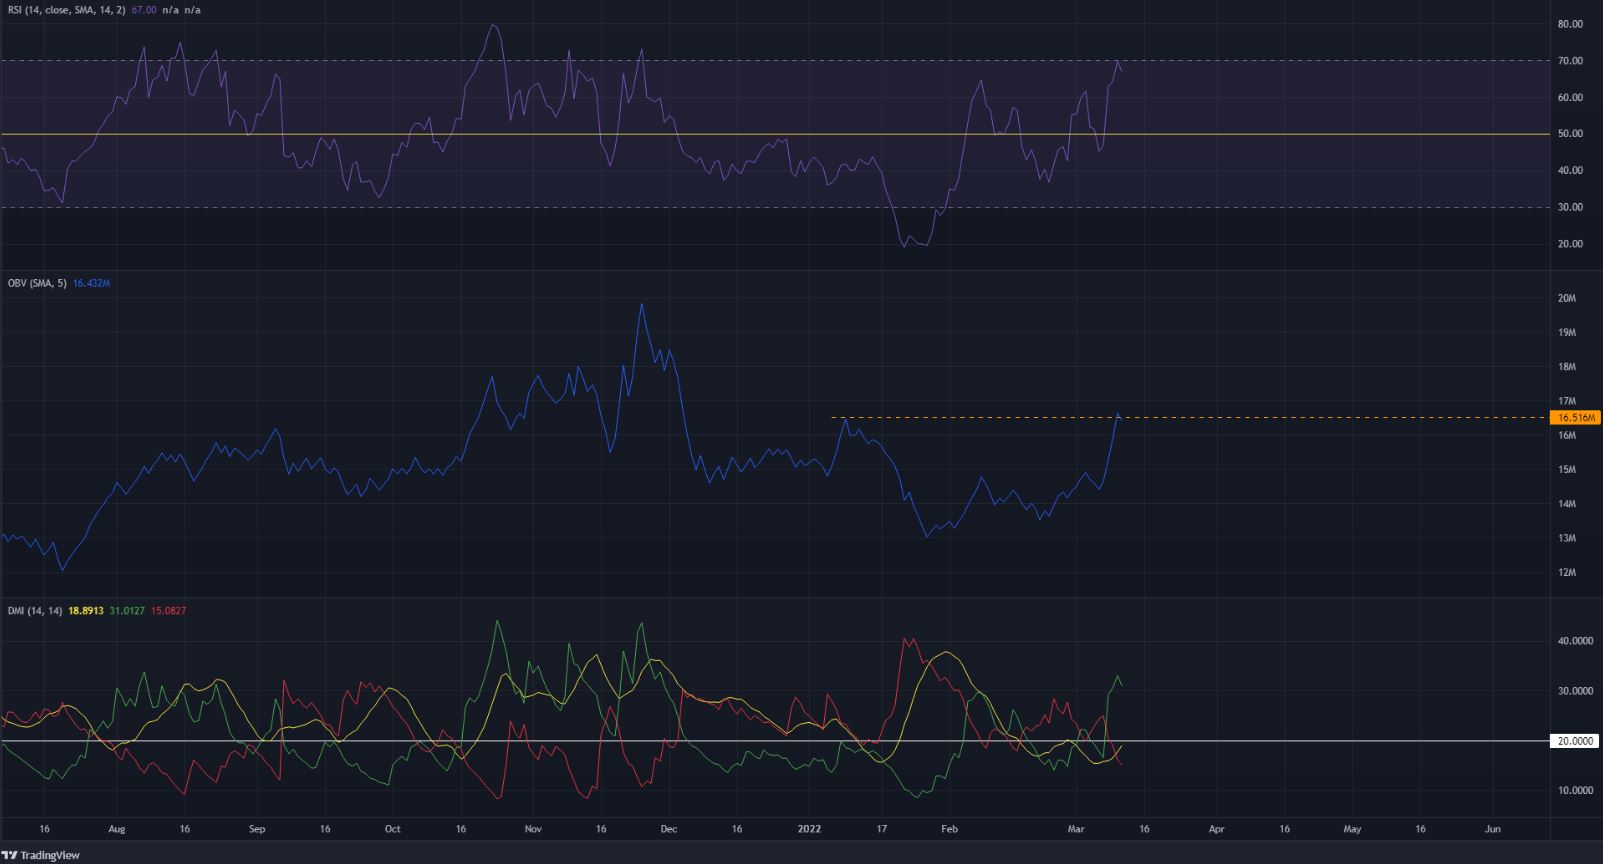
On the daily chart, the RSI rose above 60 to show strong bullish momentum. ZEC has performed well often when the daily RSI climbed above 60. The OBV was also rising in recent weeks and appeared to climb above the orange dotted line. This showed that the buying volume was high and lent credibility to the strong uptrend.
The DMI did not yet show a strong uptrend- but the +DI (green) was well above 20, and the ADX (yellow) was on the verge of climbing above 20.
Conclusion
The longer-term bearish market structure was broken once $130 and $142 resistance levels were broken. At press time, the $142 area could be revisited and would be a buying opportunity for ZEC investors, with a target of $172 and $191. A daily session close below $140 would invalidate this bullish scenario.