
- Bitcoin veterans realized profits on their BTC stashes.
- The dip in the on-chain spent output ratio could be a warning of a deeper correction.
Bitcoin’s [BTC] SOPR metric formed yet another peak, and investors have reason to fear market volatility.
The past ten days saw an uptick in selling pressure ahead of the halving as uncertainty set in. Long-term holders (LTHs) contributed to this pressure.
Analysis of the liquidation heatmap in an earlier AMBCrypto report showed that the $66k-$66.8k region was an important short-term resistance.
BTC has not crossed above this zone, heightening the chances of volatility in the coming days.
The SOPR trendline and why traders should take note
The Spent Output Profit Ratio (SOPR) reflects the degree of realized profit and loss for all coins moved on-chain.
It is measured as the ratio of the USD value of Bitcoin’s spent outputs at the spent time, or realized value, to the spent outputs at the created value.
This allows analysts to get a good idea of whether holders are at a profit. Per CryptoQuant Insights, a specific variation of the SOPR ratio showed that an increasing amount of long-term holders were cashing out.
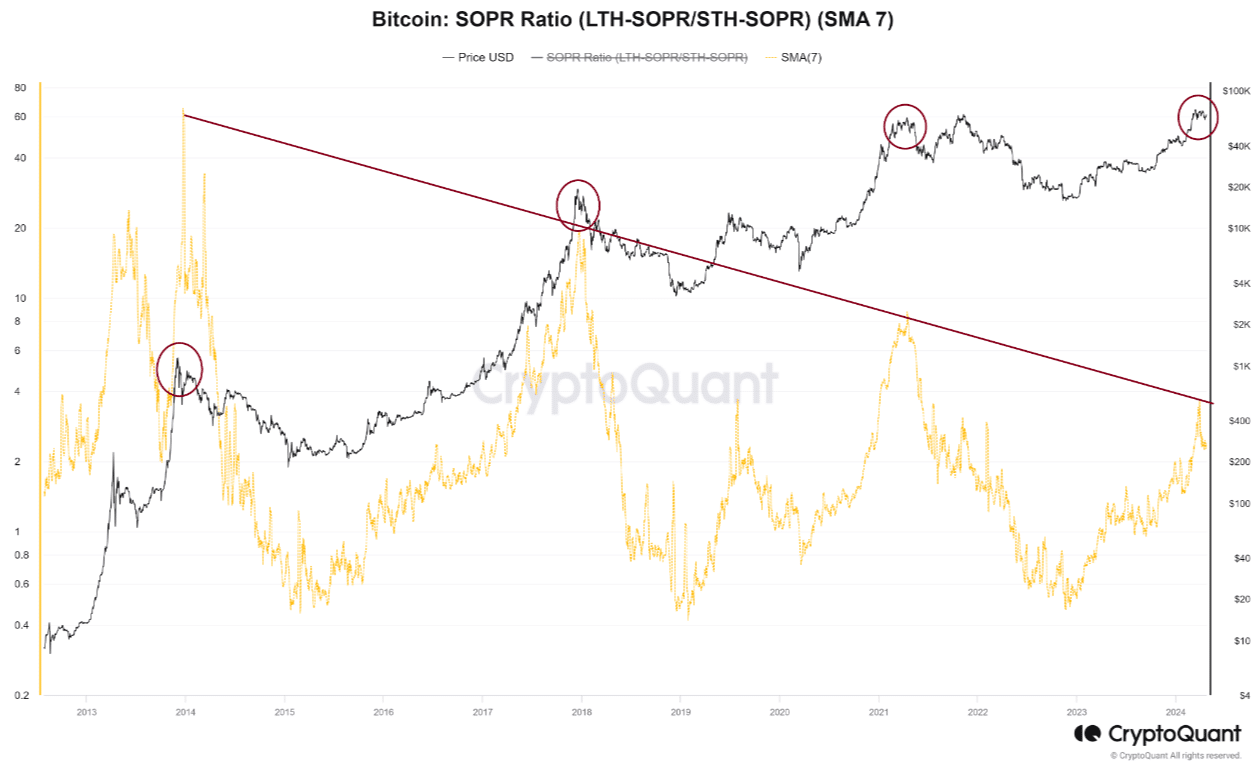
Source: CryptoQuant
The descending trendline from a decade ago showed that a potential market top was upon us. The possibility of a deeper Bitcoin correction was present due to the metric’s firm rejection from this trendline.
Short-term holders’ activity — what is the current price trend for Bitcoin?
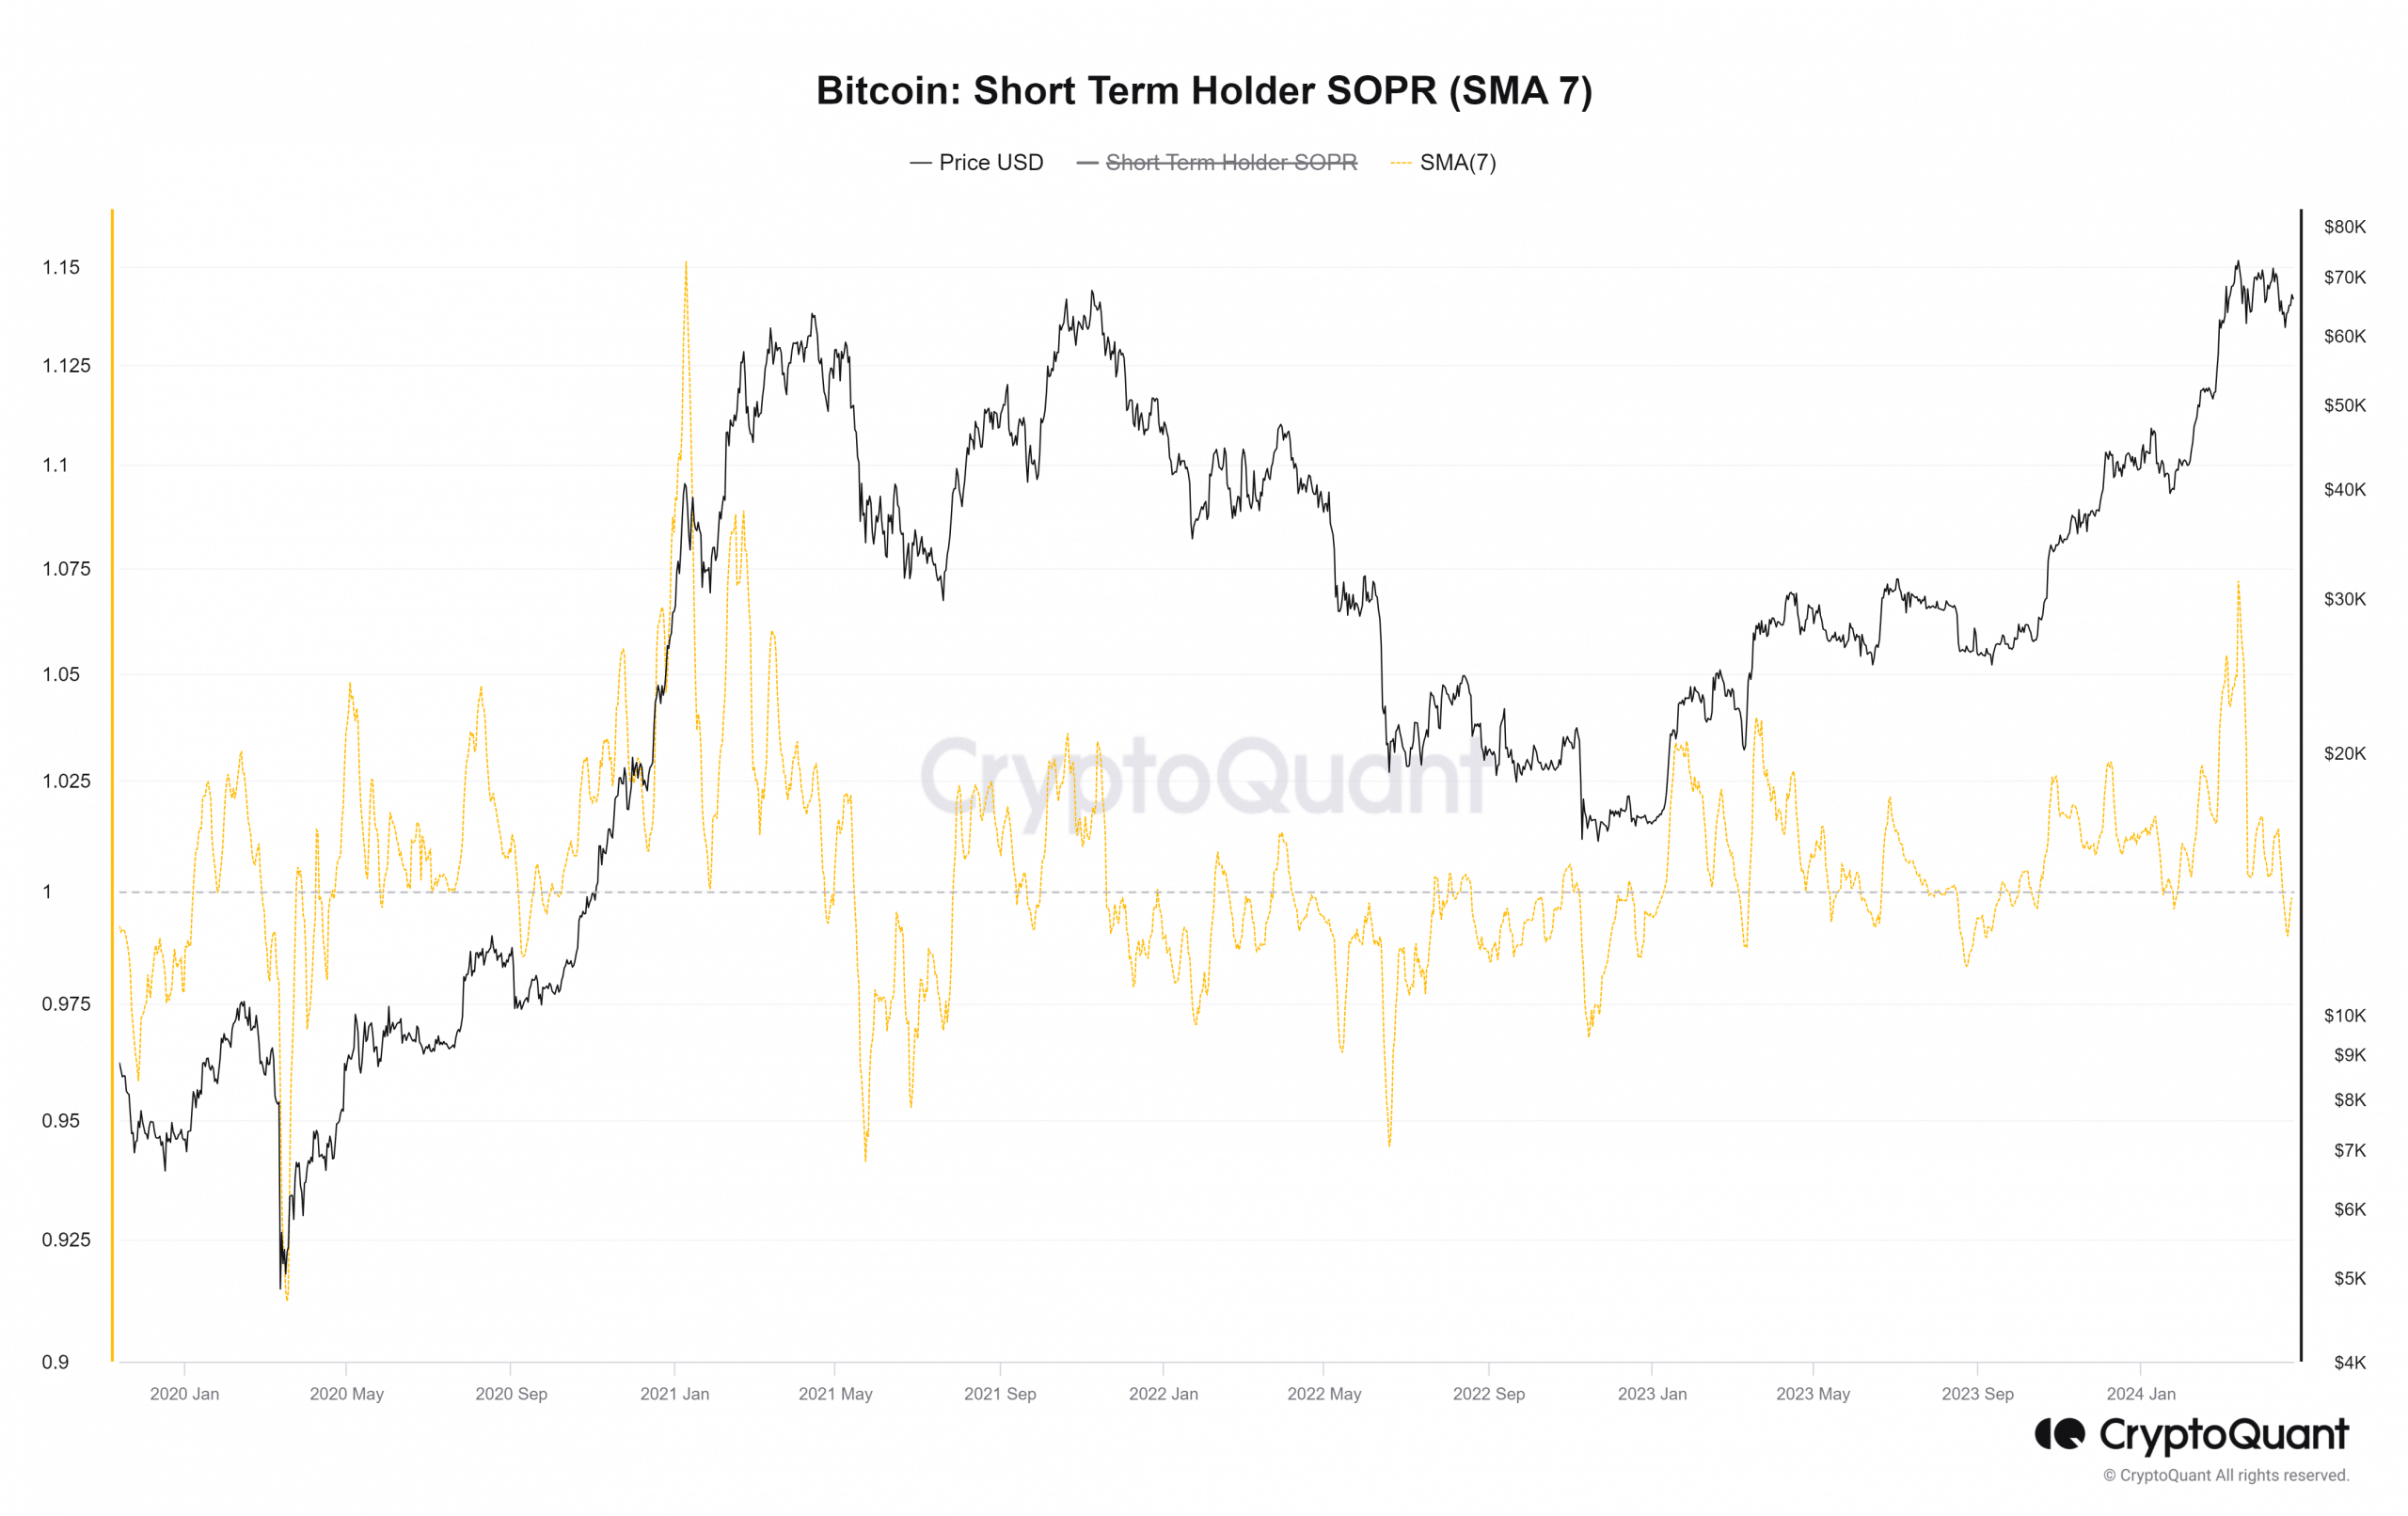
Source: CryptoQuant
The short-term SOPR deals with Bitcoin alive for over one hour but less than 155 days. The STH SOPR fell to 0.998 on the 22nd of April, showing that short-term investors were selling at a minor loss.
Comparing it with the 2020 bull run, the metric did not drop below zero after September. The halving for that cycle was in May, and a correction in August saw this ratio fall below 1.
Bitcoin may be moving down a similar path during this cycle.
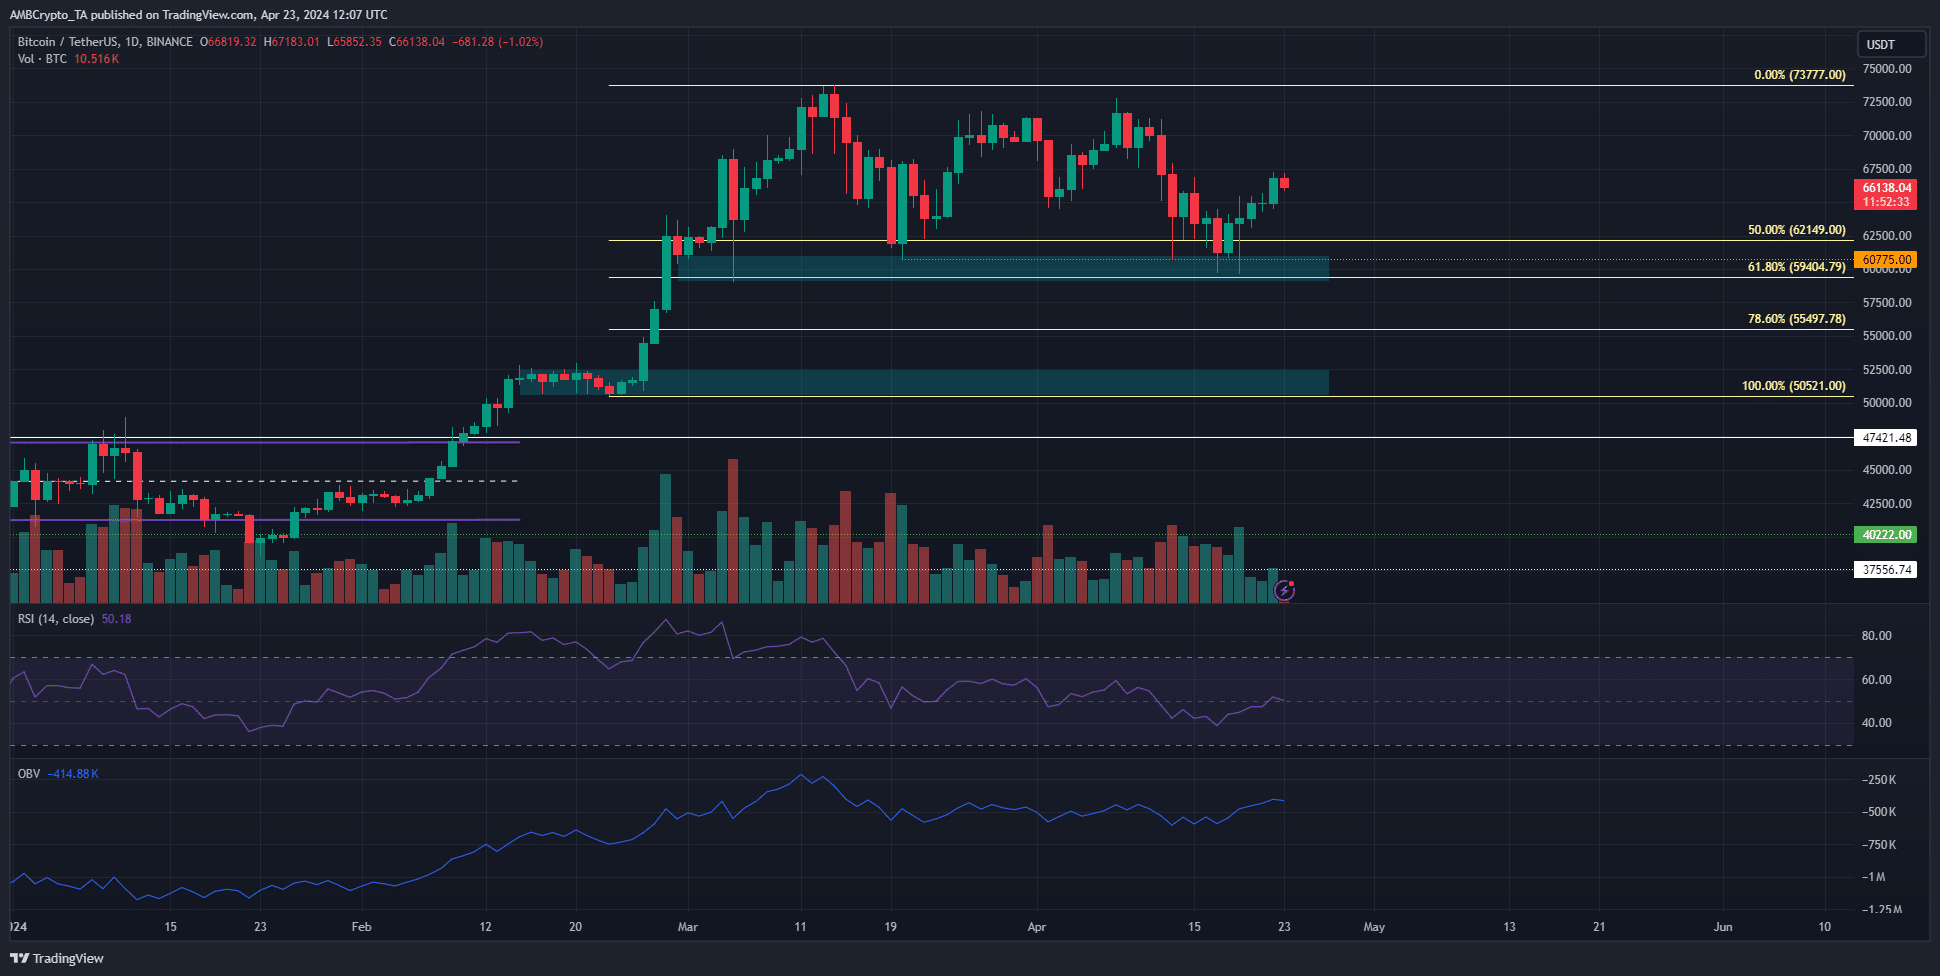
Source: BTC/USDT on TradingView
The daily chart showed that Bitcoin was trading within a range since March. The higher timeframe trend and market structure were firmly bullish.
Read Bitcoin’s [BTC] Price Prediction 2024-25
However, the RSI has meandered between 40 and 60 values in the past month, showing a lack of strong momentum.
The OBV was also unable to steer clear of the highs it made in mid-March. Encouragingly, it has crept higher in the past ten days to reflect increased buying pressure. Overall, a price correction remained possible.