1inch: Assessing why the price performance has been underwhelming

1inch, the native token of the decentralized exchange aggregator 1inch Network, has posted interesting movements in the last 24 hours.
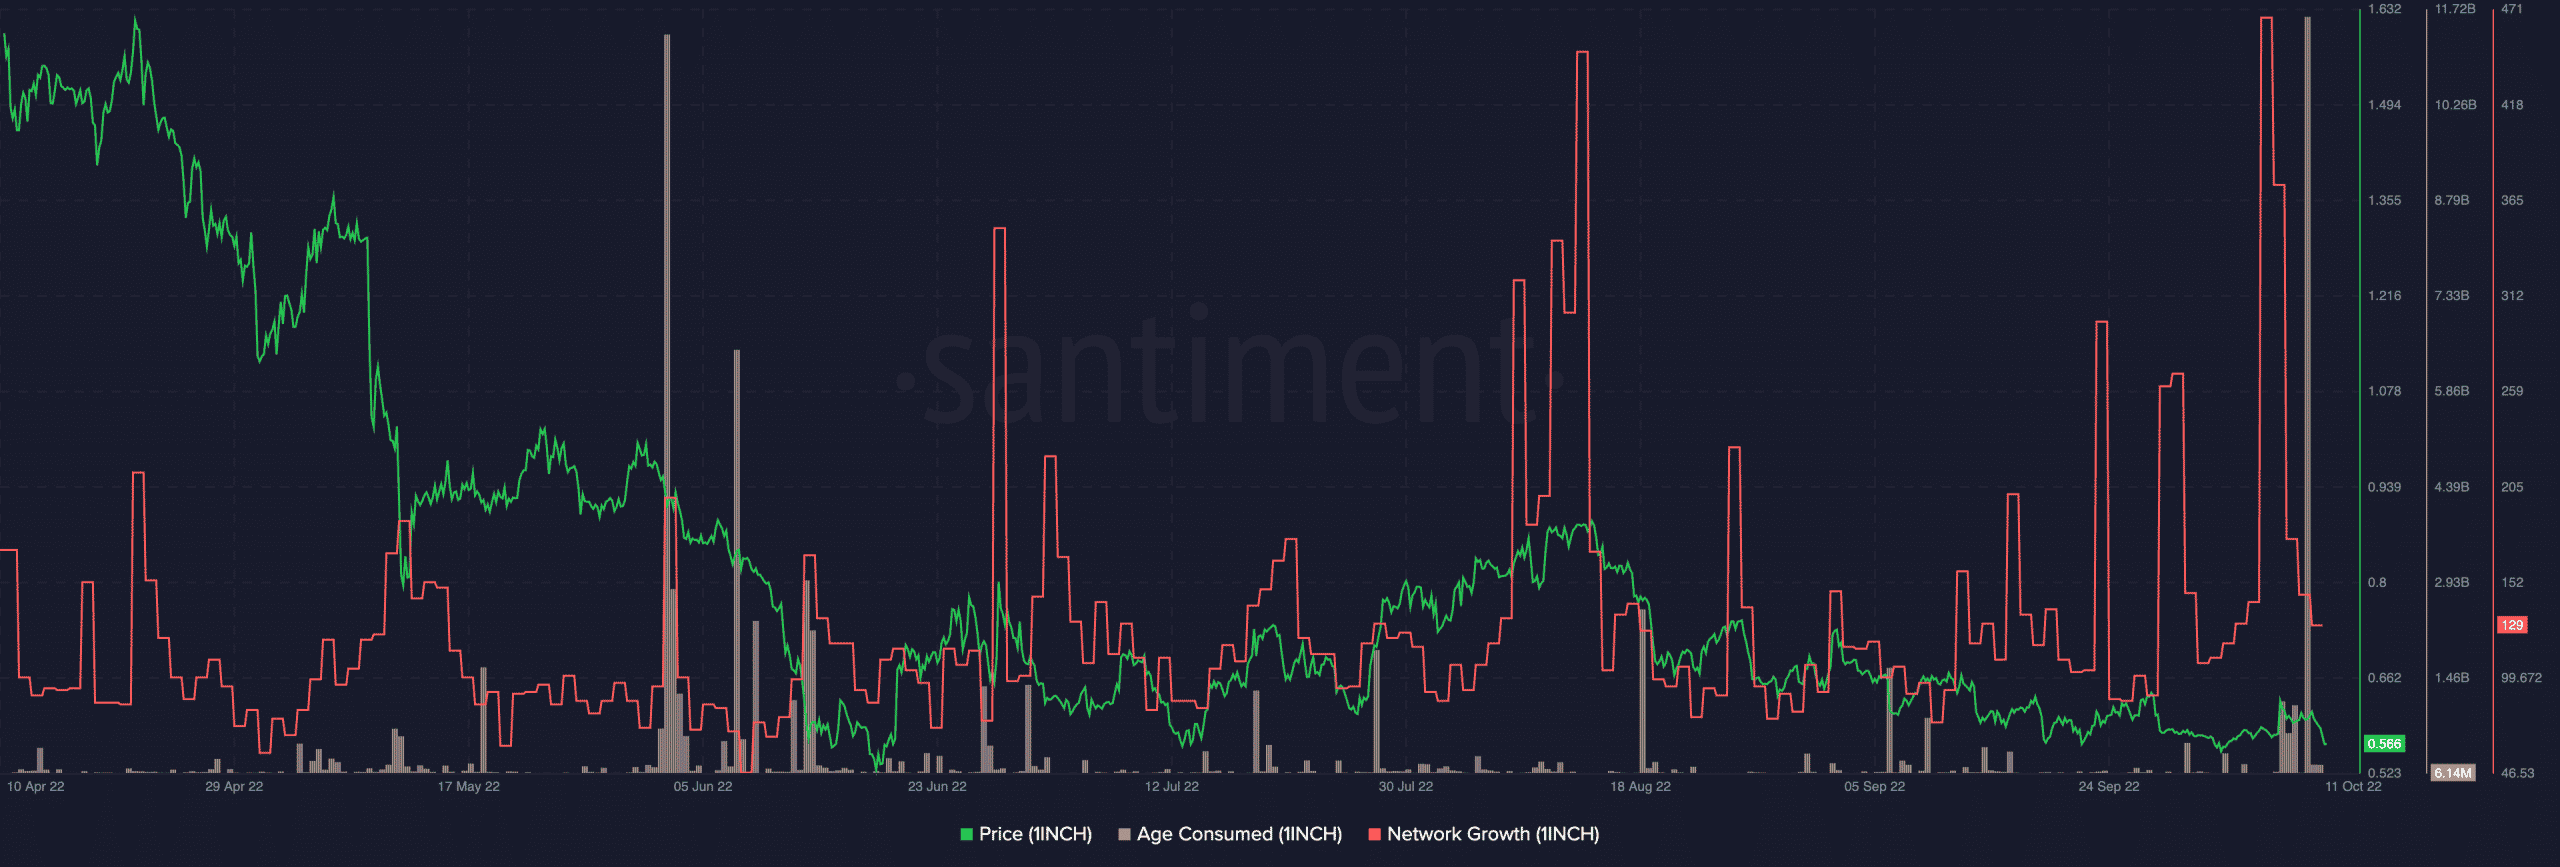
Described by blockchain analytics platform Santiment as “several anomalies” on the 1inch network, the cryptocurrency asset registered a spike in some of its key on-chain metrics within the last 24 hours.
According to data from Santiment, during the intraday trading session on Monday (10 October), the asset’s Mean Coin Age rose sharply to its highest point in the last five months. This was an indication that previously dormant 1inch tokens changed hands.
Also, 1inch saw an uptick in the number of new addresses created on its network within the same period. Data from Santiment revealed that the count of new addresses created on the 1inch network hit a 9-month high.
In light of these growths on the chain in the past 24 hours, how has the price of the asset reacted?
1 inch shorter
In spite of the significant on-chain rally in the past 24 hours, the price of 1inch failed to log the same success. According to cryptocurrency analytics platform CoinMarketCap, 1inch exchanged hands at $0.5645 at press time, with its price having declined by 7.36% over the last day.
Interestingly, the asset’s trading volume rallied by 15.49% within the same period. This indicated a price/volume divergence which usually suggests buyers’ exhaustion. It showed that buyers in the 1inch market could no longer support any growth in the asset’s price.
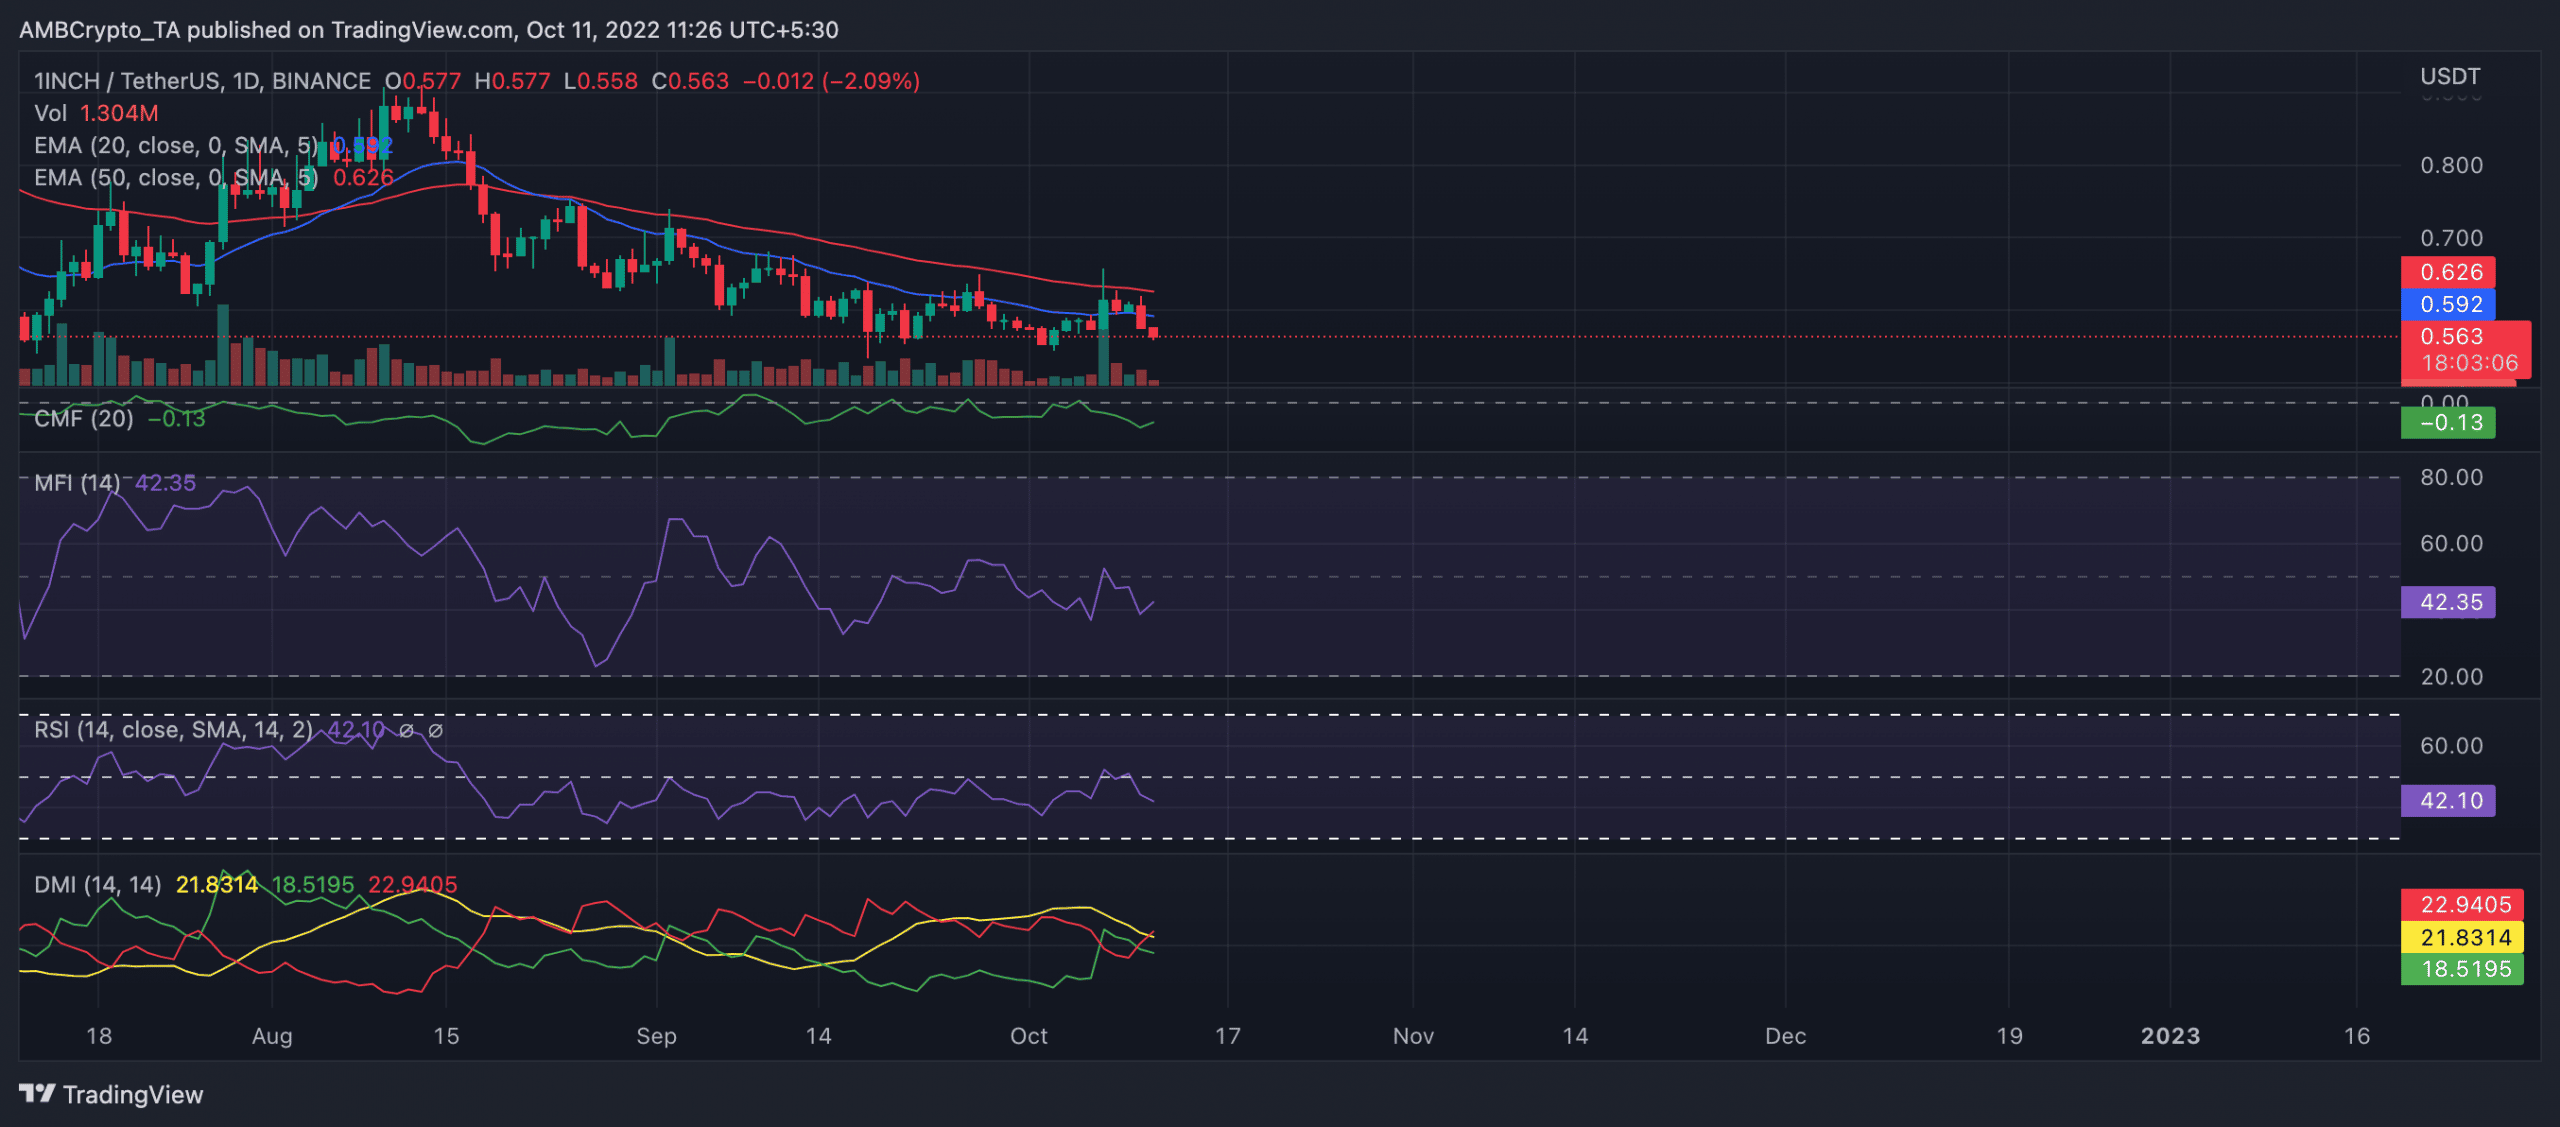
On a daily chart, key indicators were positioned in downtrends. Indicating a decline in buying pressure, the asset’s Relative Strength Index (RSI), Money Flow Index (MFI), and Chaikin Money Flow (CMF) rested below their respective neutral zones, at press time.
1inch’s RSI was positioned in a downtrend at 42.10. Also, southbound, its MFI was pegged at 42.35. Below the center line (red), the dynamic line (green) of 1inch’s CMF posted a negative -0.13. Thus, indicating dwindling buyers’ interest in accumulating more 1inch.
As to who had control of the 1inch market at press time, the Exponential Moving Average (EMA) confirmed the position that sellers had control of the market.
At the time of writing, the 20 EMA (blue) was below the 50 EMA (red) line, signifying ongoing bear action.
This position was also proved by the Directional Movement Index (DMI). At press time, the sellers’ strength (red) at 22.94 was positioned above the buyers’ (green) at 18.51.
Well, at its current price, 1inch traded at its December 2020 price level.