1INCH breaks past March’s swing high, this is where it’s headed next

Disclaimer: The findings of the following analysis are the sole opinions of the writer and should not be considered investment advice
1inch Network does not command a large share of decentralized exchange space, however, it was also not prey to large fluctuations in price. Indeed, on longer timeframes, the token 1INCH has been in a steady downtrend since mid-November, like most other altcoins. In the past month, the price has oscillated from $1.54 to $1.25, but the price action of the previous day indicated that this could have changed.
1INCH- 1H
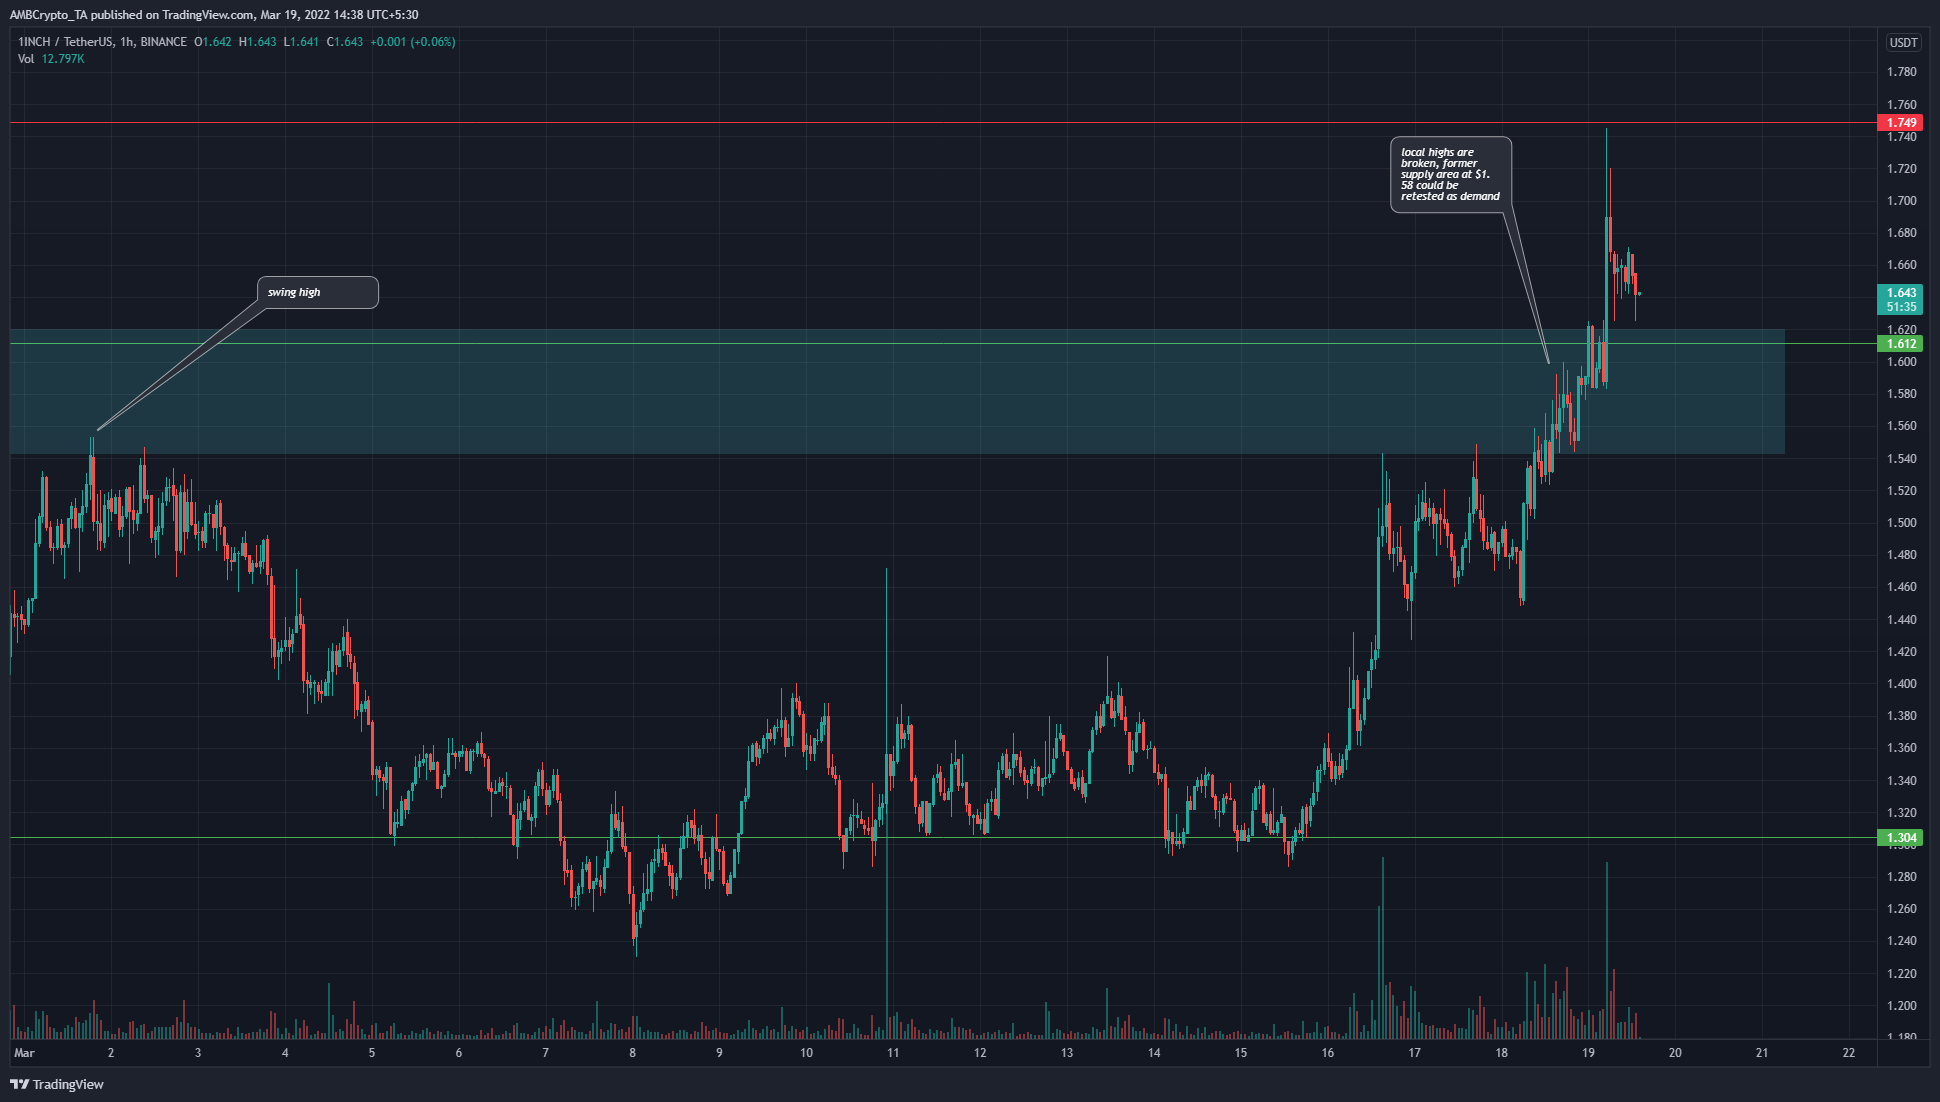
The $1.55 area has been an area of supply for 1INCH since mid-February. Since that time, the $1.55 area (cyan box), as well as the $1.47 mark, have offered significant resistance to the bulls.
Those levels were broken in the previous day of trading when price broke out past these two zones and also past the $1.61 level of former resistance. In the hours following press time, a retracement to the $1.47-$1.55 area can be expected, and are likely to offer buying opportunities.
Further north, the $1.75 and $1.99-$2 regions can be expected to serve as resistance. A rally toward those areas appeared likely, as the market structure has a bullish leaning following the move past $1.55.
Rationale
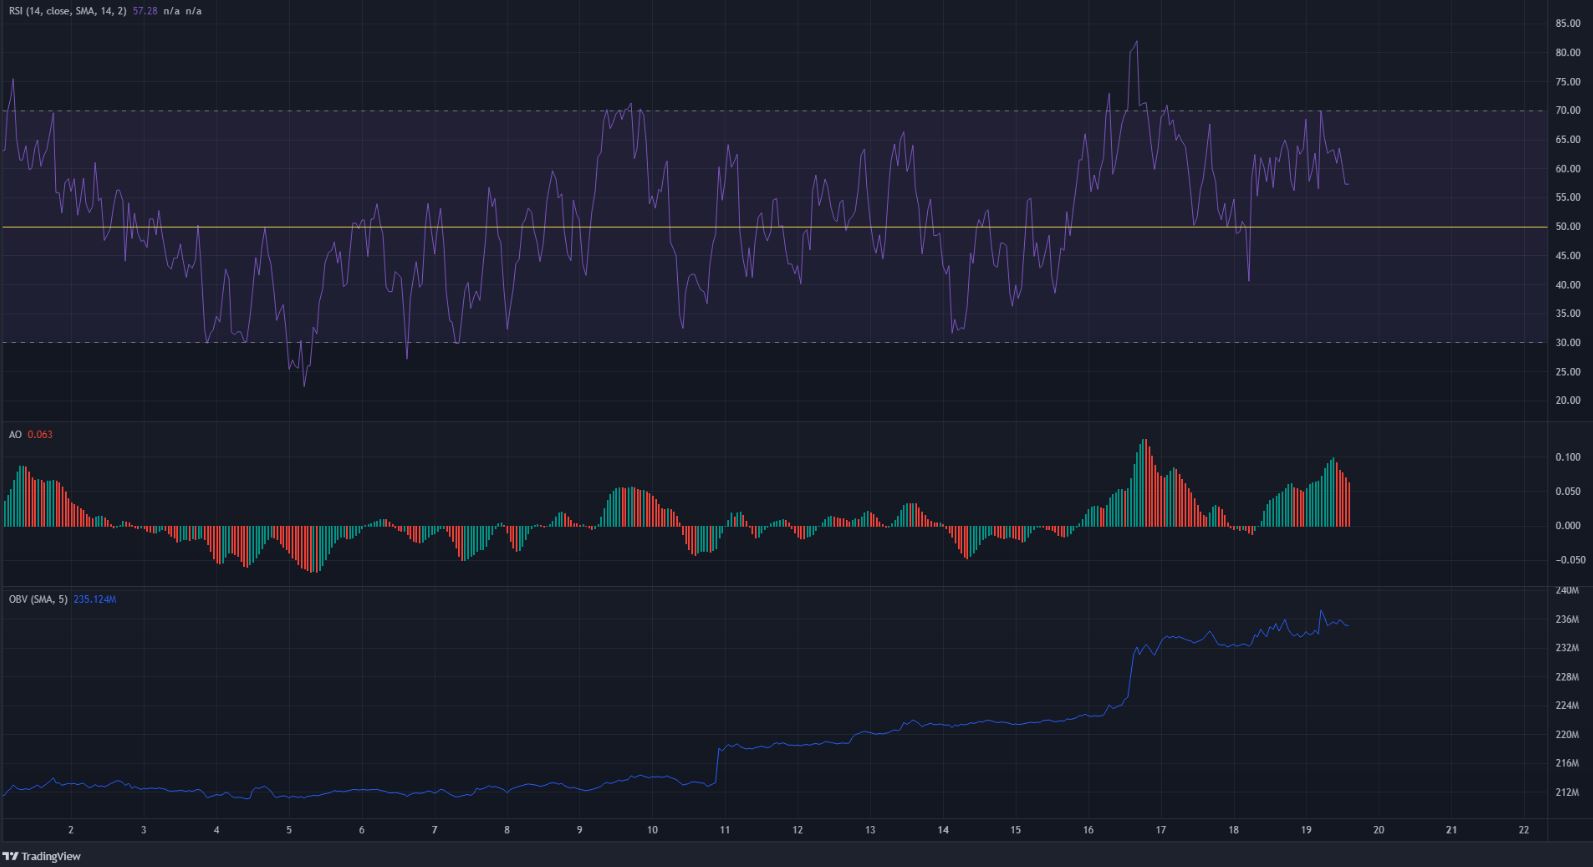
On the hourly chart, the RSI has been above the neutral 50-level for most of the past week. The Awesome Oscillator was also well above the zero line to reflect strong bullish momentum.
In that same time period, trading volume has picked up, which meant market participants are seeing the token wake up, and are positioning themselves accordingly.
The OBV has also been steadily ticking upward, which meant that buying volume has outweighed selling volume. This was inherently bullish for the prices.
Conclusion
The market structure was bullish once the $1.556 level was broken, and the indicators also showed momentum and demand was good behind the token’s rally. The $1.47-$1.55 area could be revisited once more in search of demand/liquidity, hence traders can look to buy the asset in this area. Well, the take-profit targets are $1.75, $1.84, and $1.99-$2 levels.


