90% of Bitcoin holders are in profit – Should you buy more or sell?
Most investors tapped the opportunity to accumulate BTC when prices dipped and are now enjoying profits.

- Sell pressure on Bitcoin has increased recently.
- Market indicators looked bearish and suggested a further price drop.
Expectations from Bitcoin [BTC] increased in the recent past as the king of cryptos climbed above the $46,000 mark. Just before the move north, large holders rightly identified the buying opportunity and stockpiled BTC.
Amidst all this, one of BTC’s key metrics reached a critical level, which might have an impact on its price.
Investors bought the dip!
Over the last few days, BTC bulls stepped up their game as the king of crypto’s price surpassed $46,000.
According to CoinMarketCap, BTC was up by more than 2% in the last seven days. At the time of writing, BTC was trading just below $46,000 at $45,980 with a market capitalization of over $901 billion.
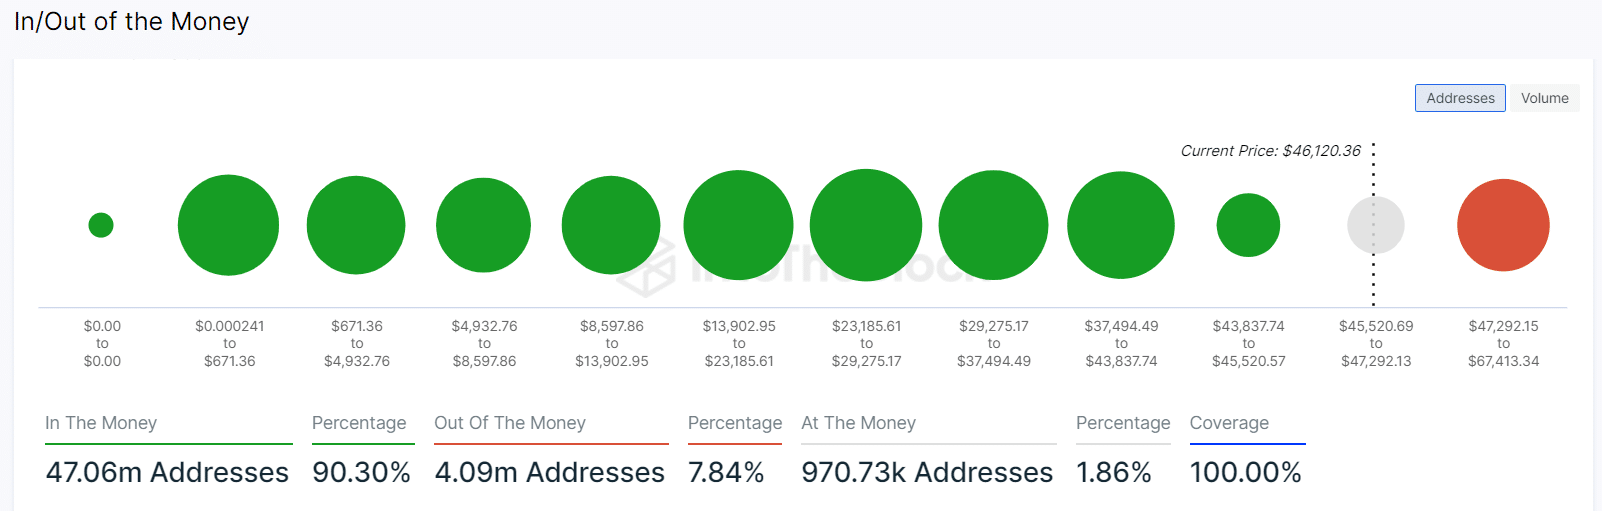
Thanks to the price uptick, most BTC investors were enjoying profits. AMBCrypto’s look at IntoTheBlock’s data revealed that 90% of BTC holders were in profit.
Before BTC’s price gained bullish momentum, investors tapped the opportunity to accumulate more BTC.
As per the latest tweet from IntoTheBlock, Bitcoin holders with >1% of the supply accumulated over 14 thousand BTC in the past week. They accumulated these coins when prices fell below the $43,000 mark.
Large holders bought the dip! Bitcoin holders holding >1% of the supply accumulated more than 14k $BTC over the past week as prices dipped below $43k. pic.twitter.com/VgBXvtaI1o
— Sentora (@SentoraHQ) January 9, 2024
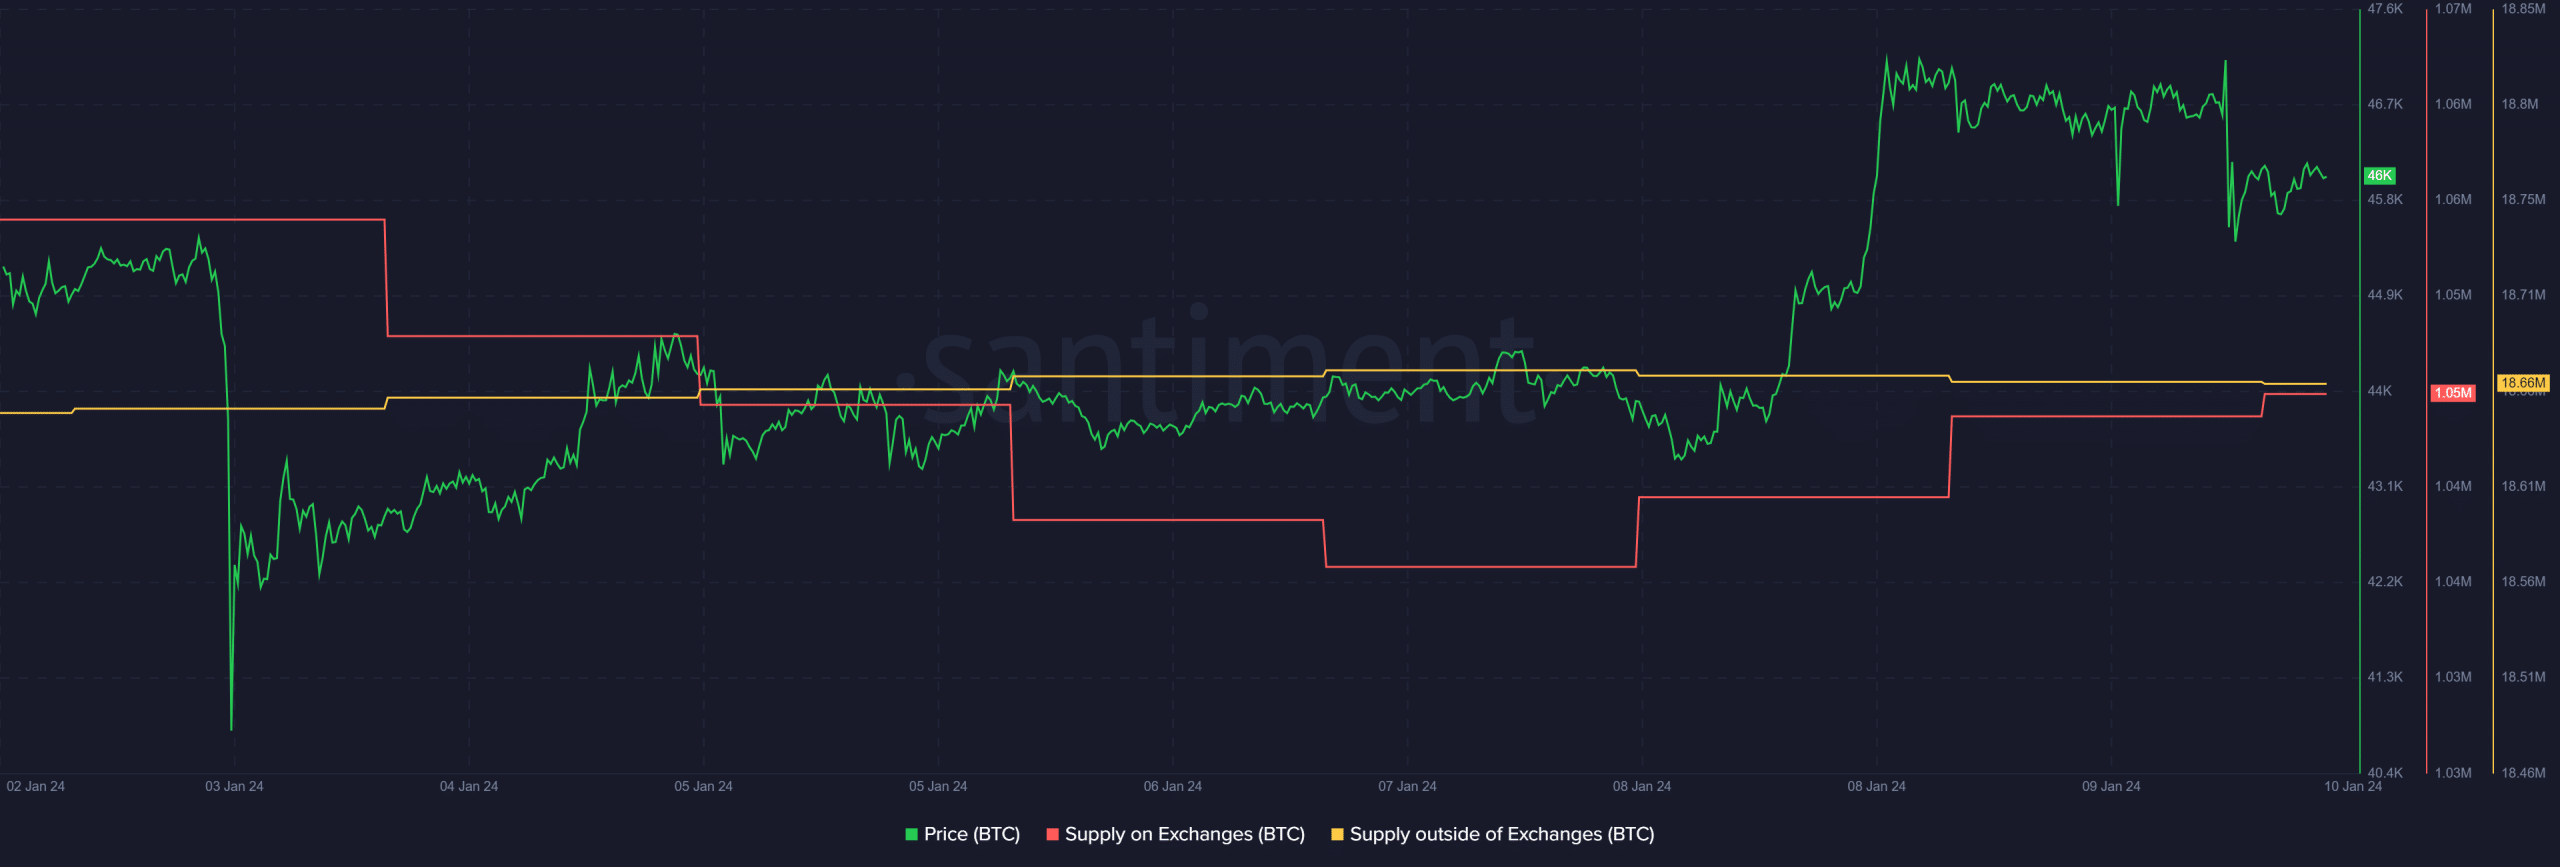
To check whether the buying pressure was still high, AMBCrypto had a look at data from Santiment and CryptoQuant. Our analysis revealed that BTC’s exchange reserve was increasing. This clearly meant that investors were selling BTC.
In fact, the distance between BTC’s supply on exchanges and supply outside of exchanges on chart was declining. This further suggested that sell pressure on Bitcoin was rising.
Bitcoin to begin another bull run soon?
While this happened, one of BTC’s key metrics reached a critical point. Blockchain Backer recently posted a tweet highlighting BTC’s Fibonacci Retracement Level.
For initiators, the metric displays horizontal lines that indicate where support and resistance are likely to occur.
Bitcoin Market Cap hits 0.618 Fibonacci Retracement level as BTC ETF decision nears.
We said for two years we'd get here. Thousands screamed it'd never happen.
Now, they FOMO in. pic.twitter.com/H5ZHknZHHb
— Blockchain Backer (@BCBacker) January 8, 2024
As per the tweet, the Bitcoin market cap hit the 0.618 Fibonacci retracement level. When the metric reached that level in 2021, BTC’s price reached an all-time high over the following weeks. However, this time things looked a little different as BTC’s daily chart turned red.
The reason behind this sudden downtrend could be attributed to the FUD around ETFs as reported previously.
Therefore, to see whether the possibility of BTC starting a bull rally was likely, AMBCrypto took a look at BTC’s daily chart.
Read Bitcoin’s [BTC] Price Prediction 2024-25
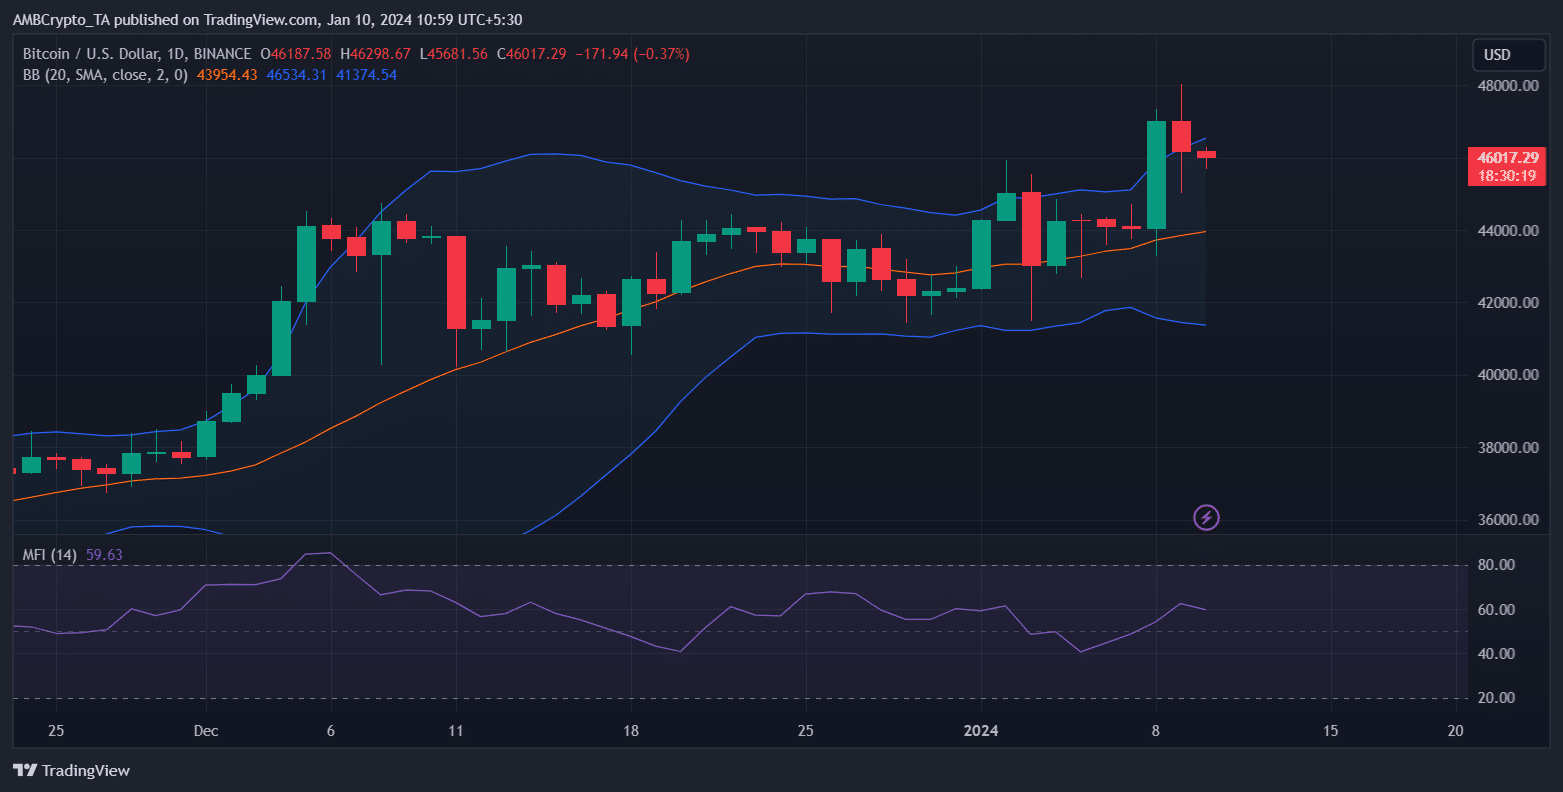
Our analysis found a few bearish indicators. For example, Bitcoin’s price touched the upper limit of the Bollinger Bands.
Additionally, its Money Flow Index (MFI) also registered a slight downtick, increasing the chances of a continued price drop in the coming days.