95% of ONT holders still in red despite 33% hike – Price ceiling ahead?
The total value locked (TVL) of the Ontology chain has steadily trended south since May 2021.

- Ontology’s price pump on Monday excited traders looking for opportunities
- ONT’s on-chain metrics did not show high levels of activity and utility
Ontology [ONT] gained by 33.84% in two hours on Monday, 13 January. The Open Interest surged by more than 400% as speculators rushed to try and find profitable trades.
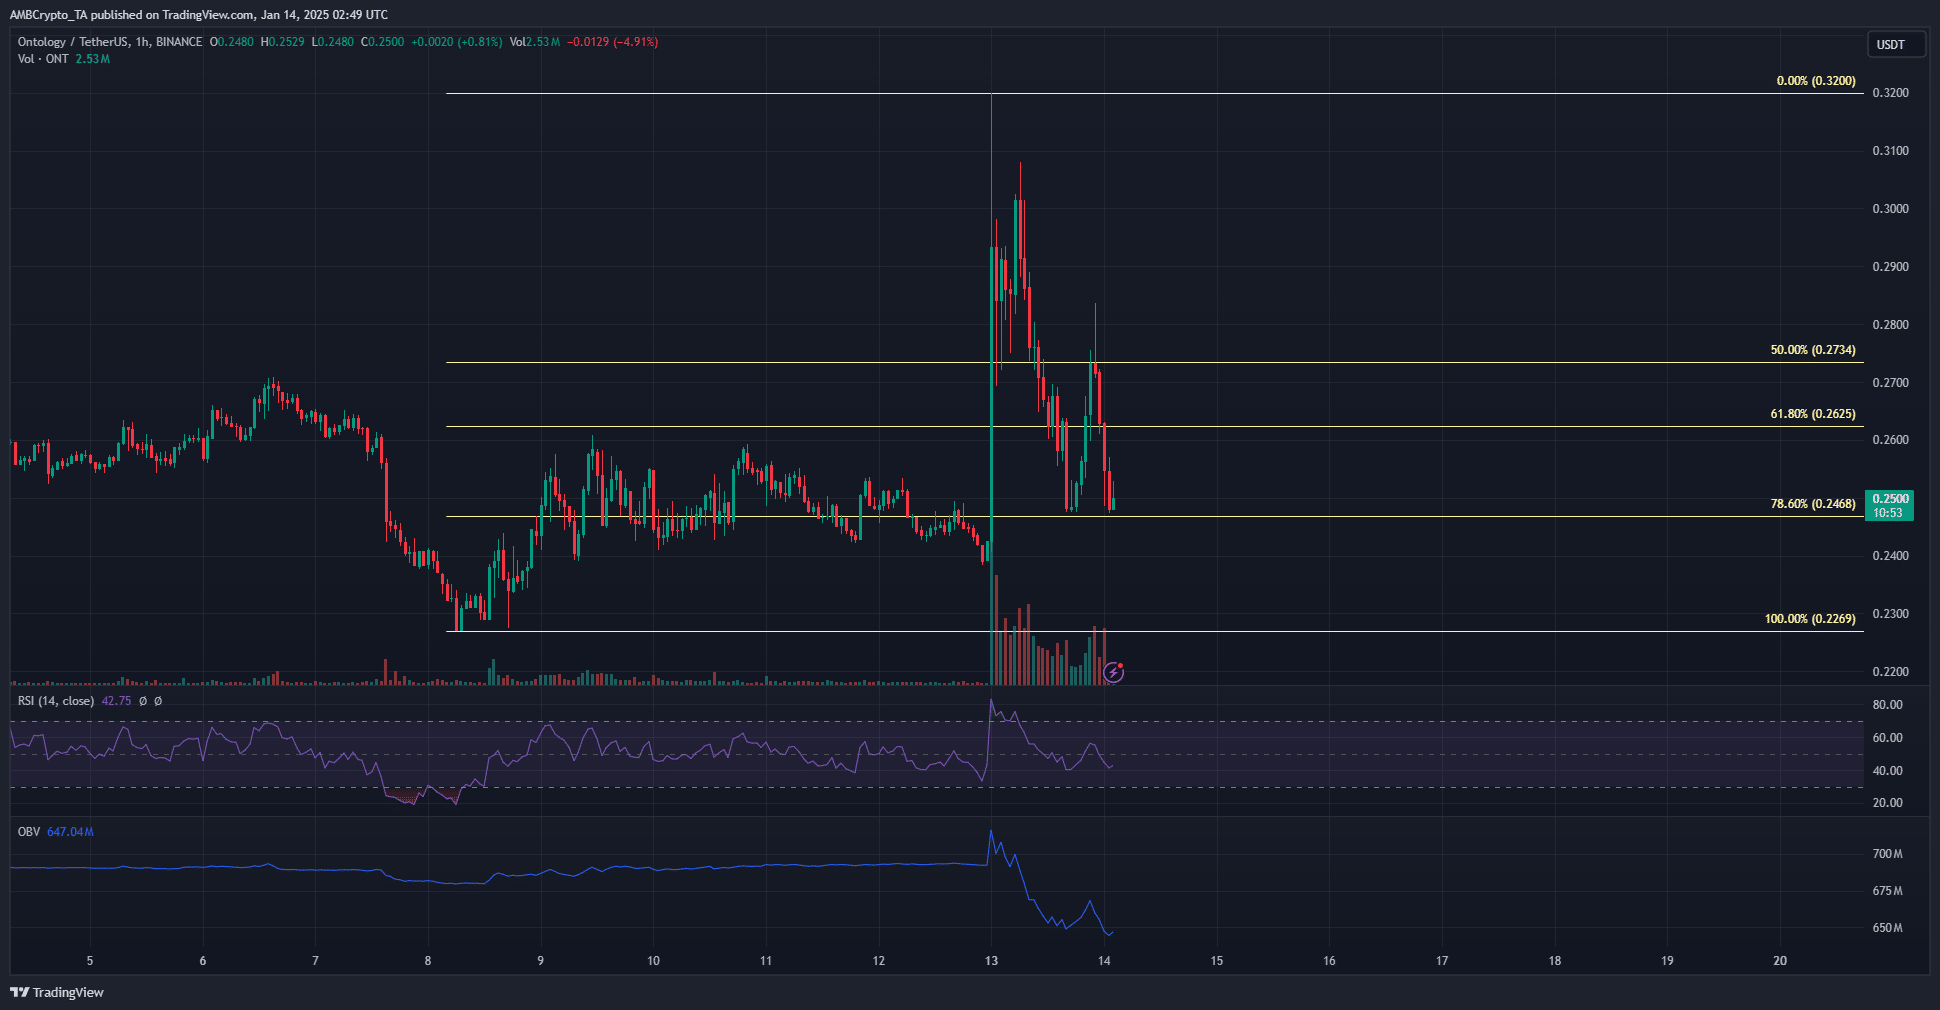
However, ONT was quick to retrace from its pump. It still has a bullish outlook for the coming days, since the 78.6% retracement level at $0.246 has been defended upon retests. However, the OBV took a major hit. The RSI was also below neutral 50 to indicate bearish momentum.
What are the chances of a steady uptrend for Ontology? Well, the data at hand at press time was not encouraging.
Ontology metrics all have on thing in common
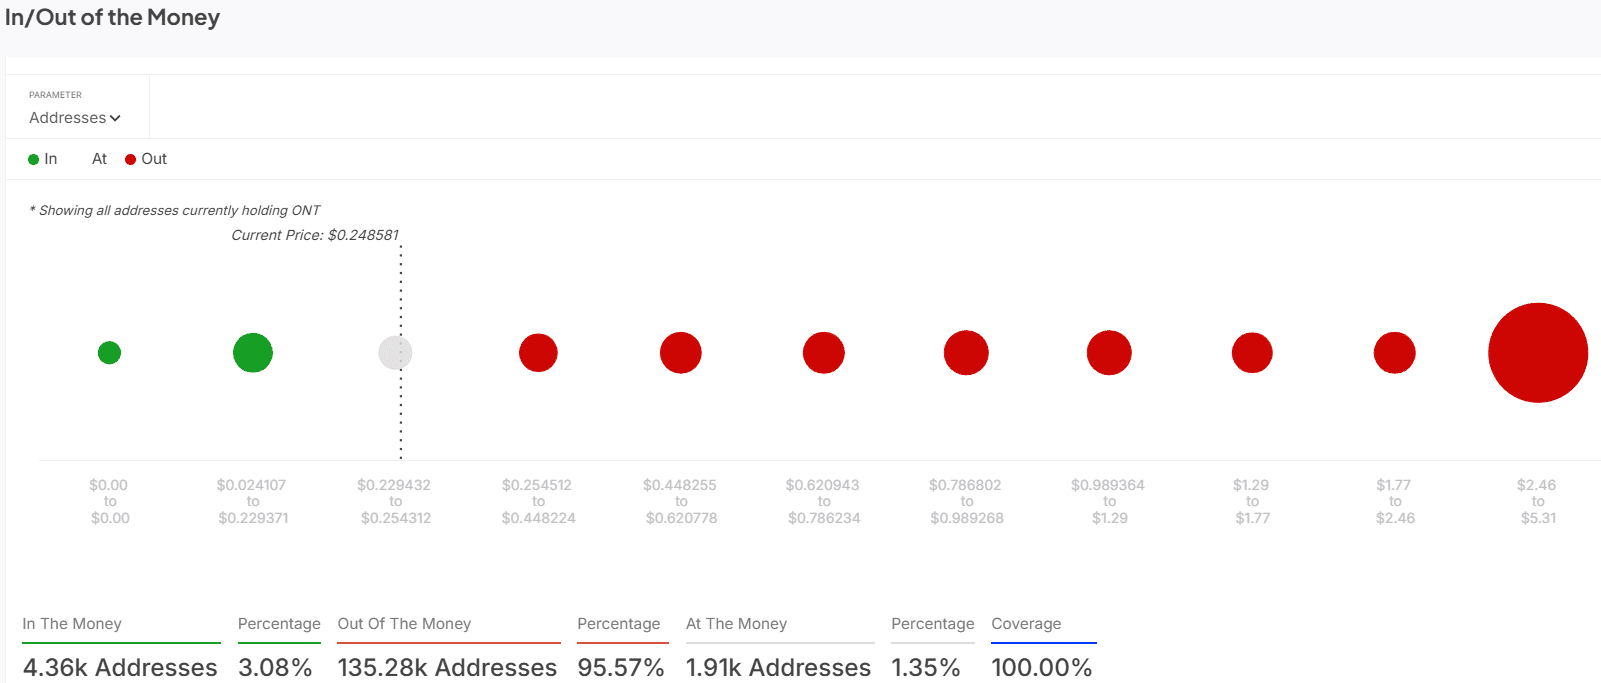
According to IntoTheBlock, 95.57% of all addresses holding ONT were out of the money. A tiny 3.08% were in the money. This indicated that further price gains would be met with enormous selling pressure. This would be due to underwater holders trying to get out at break-even or a slight profit.
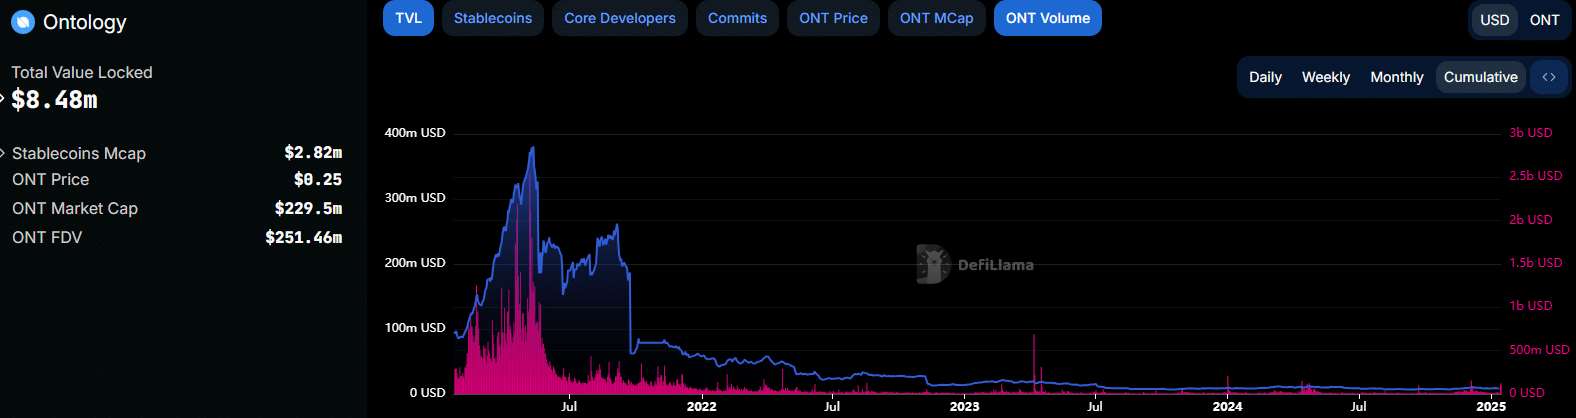
The total value locked (TVL) of the Ontology chain has steadily trended south since May 2021. the TVL went from $379.09 million in May 2021 to $8.48 million at press time. This was likely due to a loss of confidence from investors.
The bear market conditions of the previous years, combined with a decline in on-chain activity, likely led to users shifting their funds to other opportunities. Despite the bullish conditions of recent months, they have not returned, with the same evidenced by ONT volume trends.
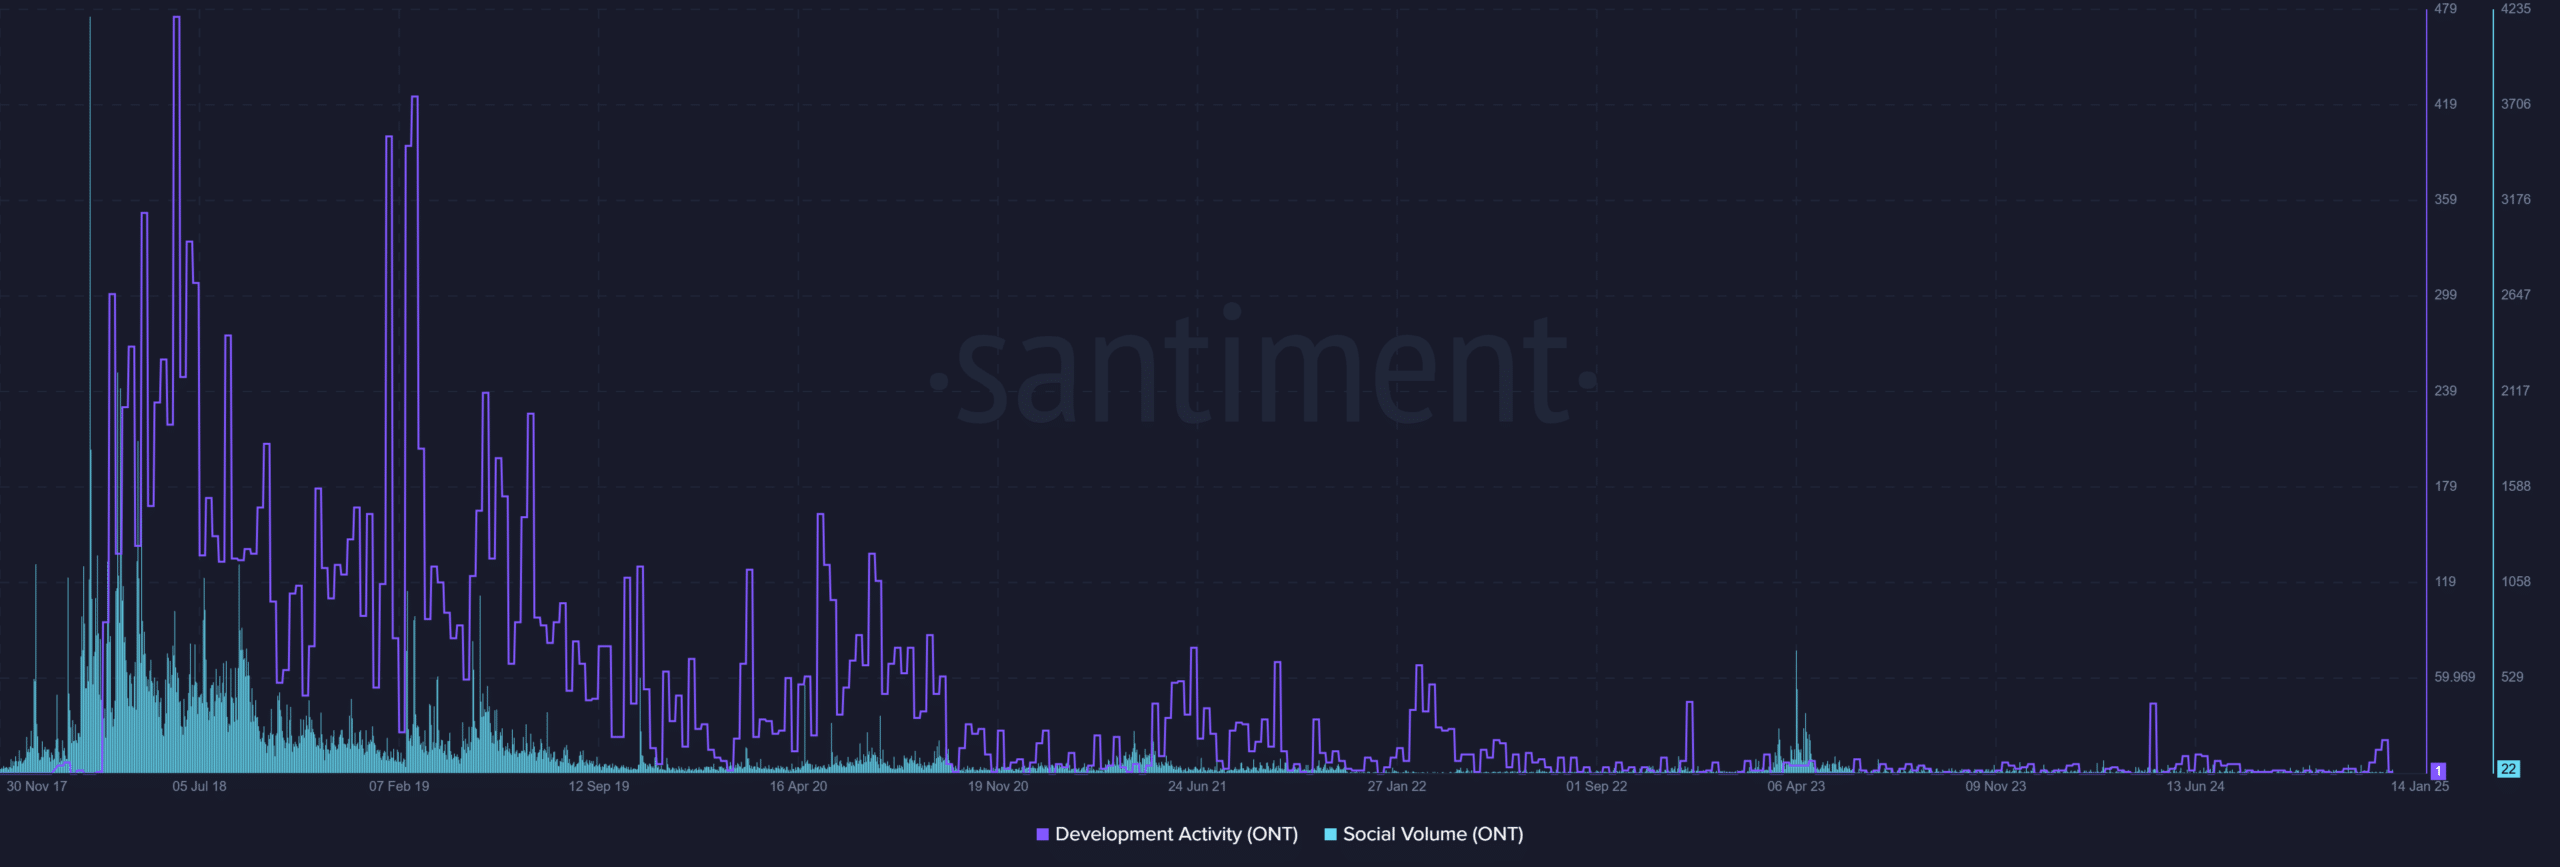
Another disheartening sight was the steady decline in development activity. From 2018 to 2022, the trend was southbound. Since then, it has been consistently low. The social volume mirrored the price action trends too.
Read Ontology’s [ONT] Price Prediction 2025-26
The commonality among the metrics is that they all pointed to a fading L1 chain. Users have not been returning to the chain and despite the short-term price gains, investors likely want to look elsewhere for better opportunities.


