Bitcoin Cash Price Analysis: 08 January

Disclaimer: The findings of the following analysis is the sole opinion of the writer and should not be taken as investment advice
Bitcoin’s value hit another all-time high at $40k and as expected the value of other cryptos including its hard fork, Bitcoin Cash [BCH] has also been rallying. However, the digital asset has currently been facing downward pressure as its price fell by almost 7% in the past 24 hours.
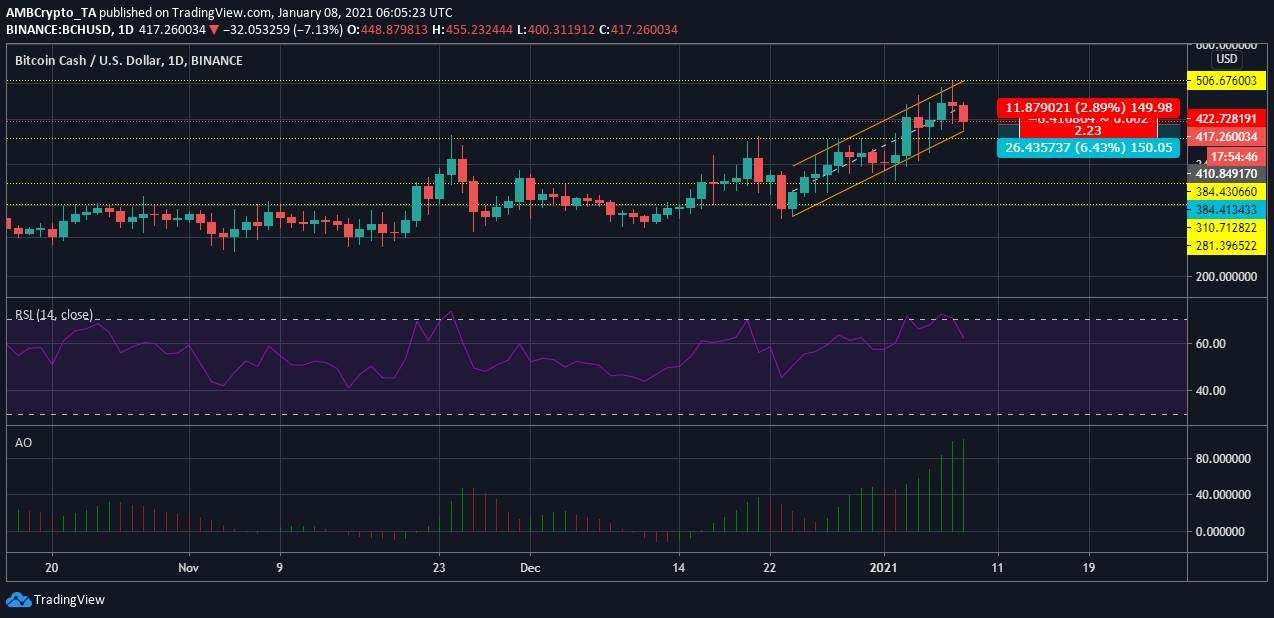
At the time of writing, BCH was being traded at $417, while its lowest point was noted at $400 according to the daily candle.
Bitcoin Cash one day chart

Source: BCH/USD on TradingView
BCH’s daily chart outlined the cryptocurrency’s growing price within an ascending channel. The ascending channel has pushed through various resistances and caused the price of BCH to surge to a new high at $505.
As the hard fork of BTC continued to trade above $400, it is witnessing selling pressure, which would be an opportunity for the traders to short the coin and gain during the selling pressure.
Reasoning
The Relative Strength Index has just dipped under the overbought zone given the sell-off it was witnessing while writing. This pressure might have been induced by the Bitcoin downtrend visible at $38k. This pressure in the BTC market could push the price further down.
Whereas, the Awesome Oscillator has not yet reflected these changes in the market. It was currently showing strong Green bars indicating strong buying of BCH, but as the red daily candle takes shape, AO will reflect the dropping buyers’ momentum and increased selling.
However, the trend in the market remained bullish as the 50 moving average also remained well under the price bars. Even if the price drops, the trend may not reverse on a whim.
Position
Entry: $410
Stop-Loss: $422
Take-Profit: $384
Risk-to-Reward: 2.23
Conclusion
The Bitcoin Cash market has been noting a falling value of the digital asset in a bullish market. This could provide a brief opportunity for the traders to take profit to the next support at $384.


