Chainlink Price Analysis: 16 January

Disclaimer: The findings of the following analysis are the sole opinions of the writer and should not be taken as investment advice
Chainlink looked to be strongly bullish on the price charts as it broke past its previous all-time high to touch $22.56. While the market-wide correction on 10 January saw LINK drop from $17 to $12.6, its recovery since has been extraordinary. In fact, a pullback to the confluence of support levels at $20 would be an ideal scenario for traders to enter or add to a long position.
Chainlink 12-hour chart
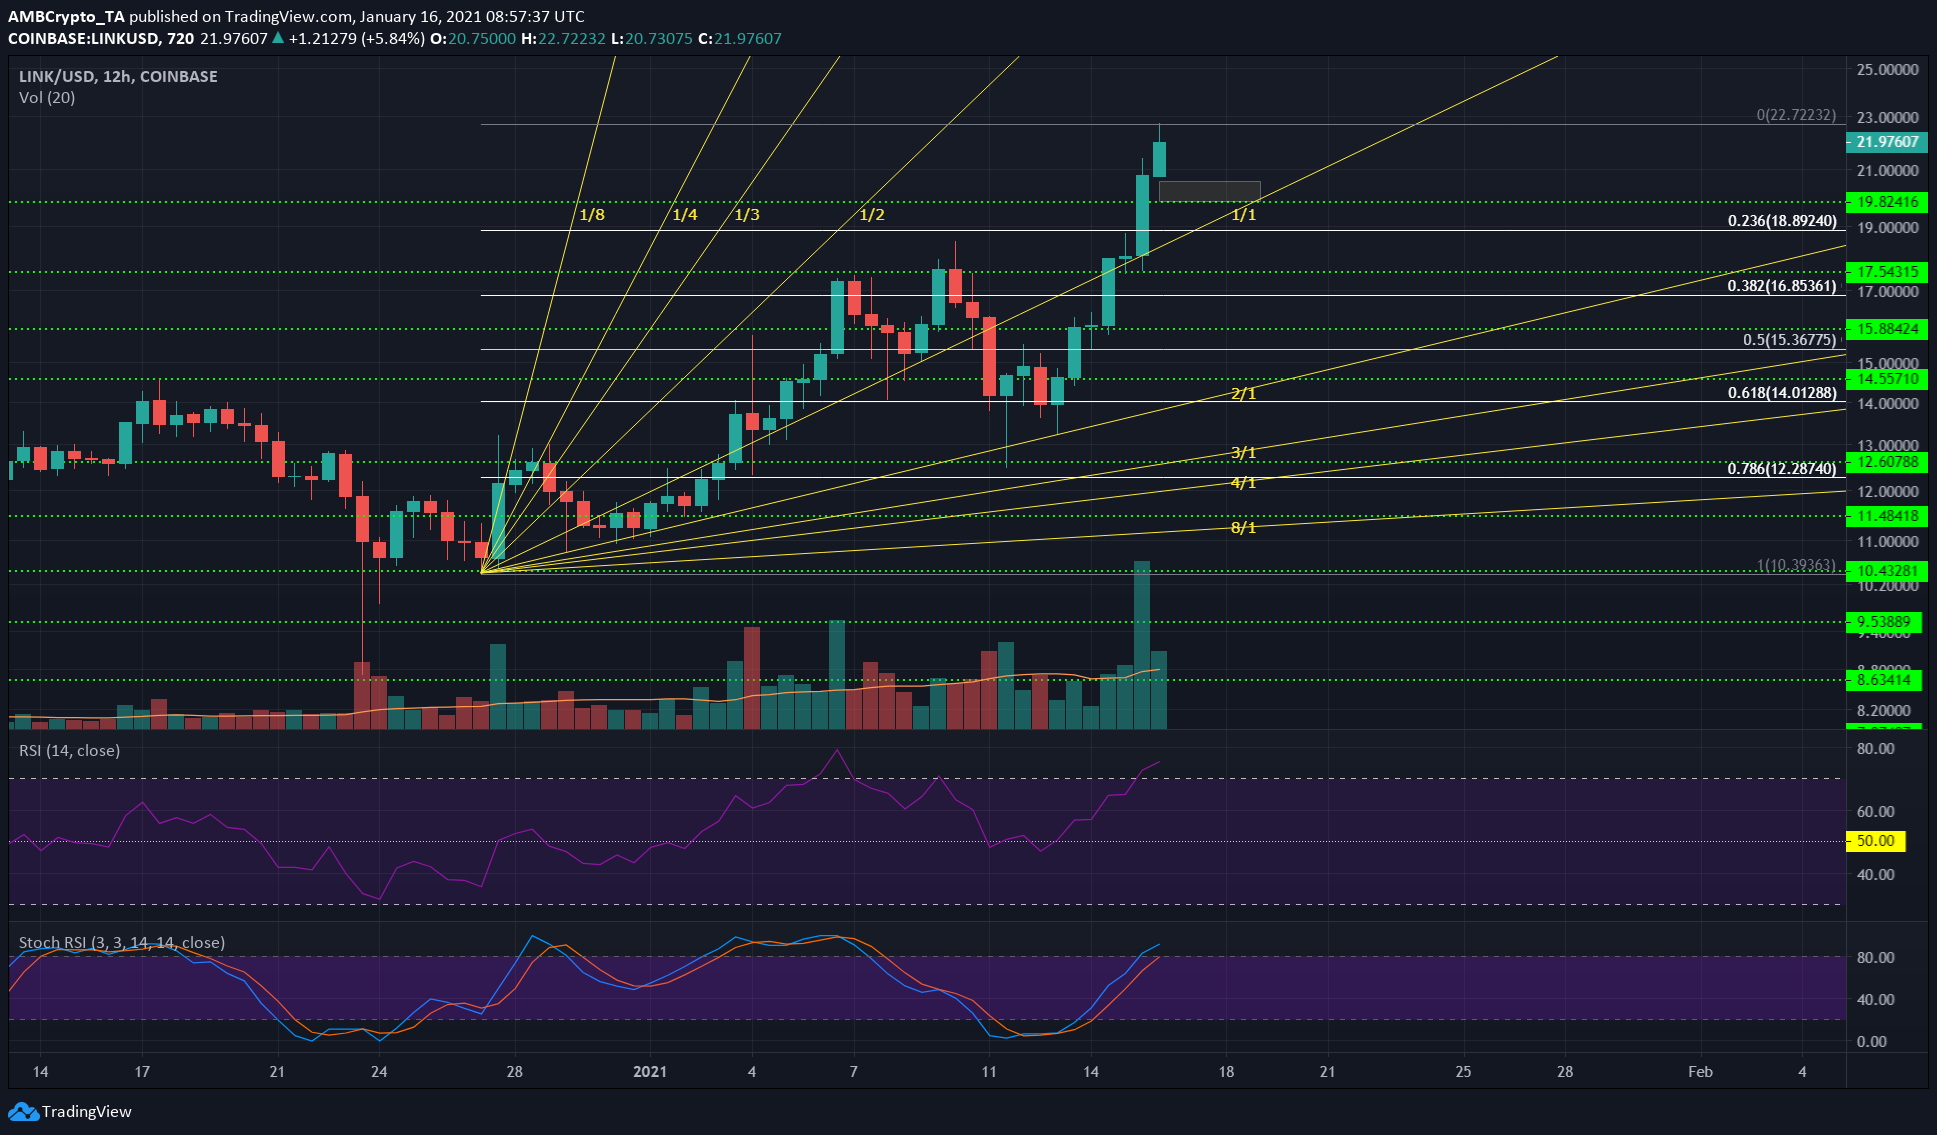
Using the double bottom formed by LINK in late December at $10.4 as the beginning of LINK’s ascent, both Fibonacci retracement levels (white), as well as Gann fan lines (yellow), were plotted. These lines gave some levels of support for LINK and projected upside targets.
A move past the ATH means that, on the longer timeframes, LINK does not have any resistance to the upside.
The surge from $14 did not yet show clear signs of an impending pullback, while the 27% extension projected an upside of $28 for LINK in the coming weeks.
In the event of a pullback, some areas of interest were highlighted where the price can expect a reaction. Further, LINK’s shorter timeframes showed a bearish divergence between the price and momentum, something that could contribute to a minor dip on LINK’s charts.
On the 12-hour chart, the RSI and the Stochastic RSI climbed into the overbought territory, but this was no evidence of an impending pullback. Rather, it pointed to the strength of bullish momentum behind LINK.
The first was the $19.8-$20 region. This region is a confluence of the previous ATH, as well as an area where the price stalled on the shorter timeframe, making it a former region of supply-turned-demand.
Beneath this line, there were the $18.89 and $17.5-levels of support, but there was no evidence yet to indicate a drop deep enough to test these levels.
The long-term outlook for LINK still remained strongly bullish at press time, and the next week or two could see LINK reach the projected $28-mark. For just the surge from $13.2 (The dip on 13 January) to $22.7, the 27% extension level gave a target of $26.


