
XRP formed a bullish pattern on the charts but was quite negatively impacted by Bitcoin’s tumble of the past few days. News surrounding the SEC lawsuit has not been positive lately either- Moneygram, the US-based money transfer company, recently suspended its partnership with Ripple Labs, citing the ongoing litigation with the SEC.
XRP 12-hour chart
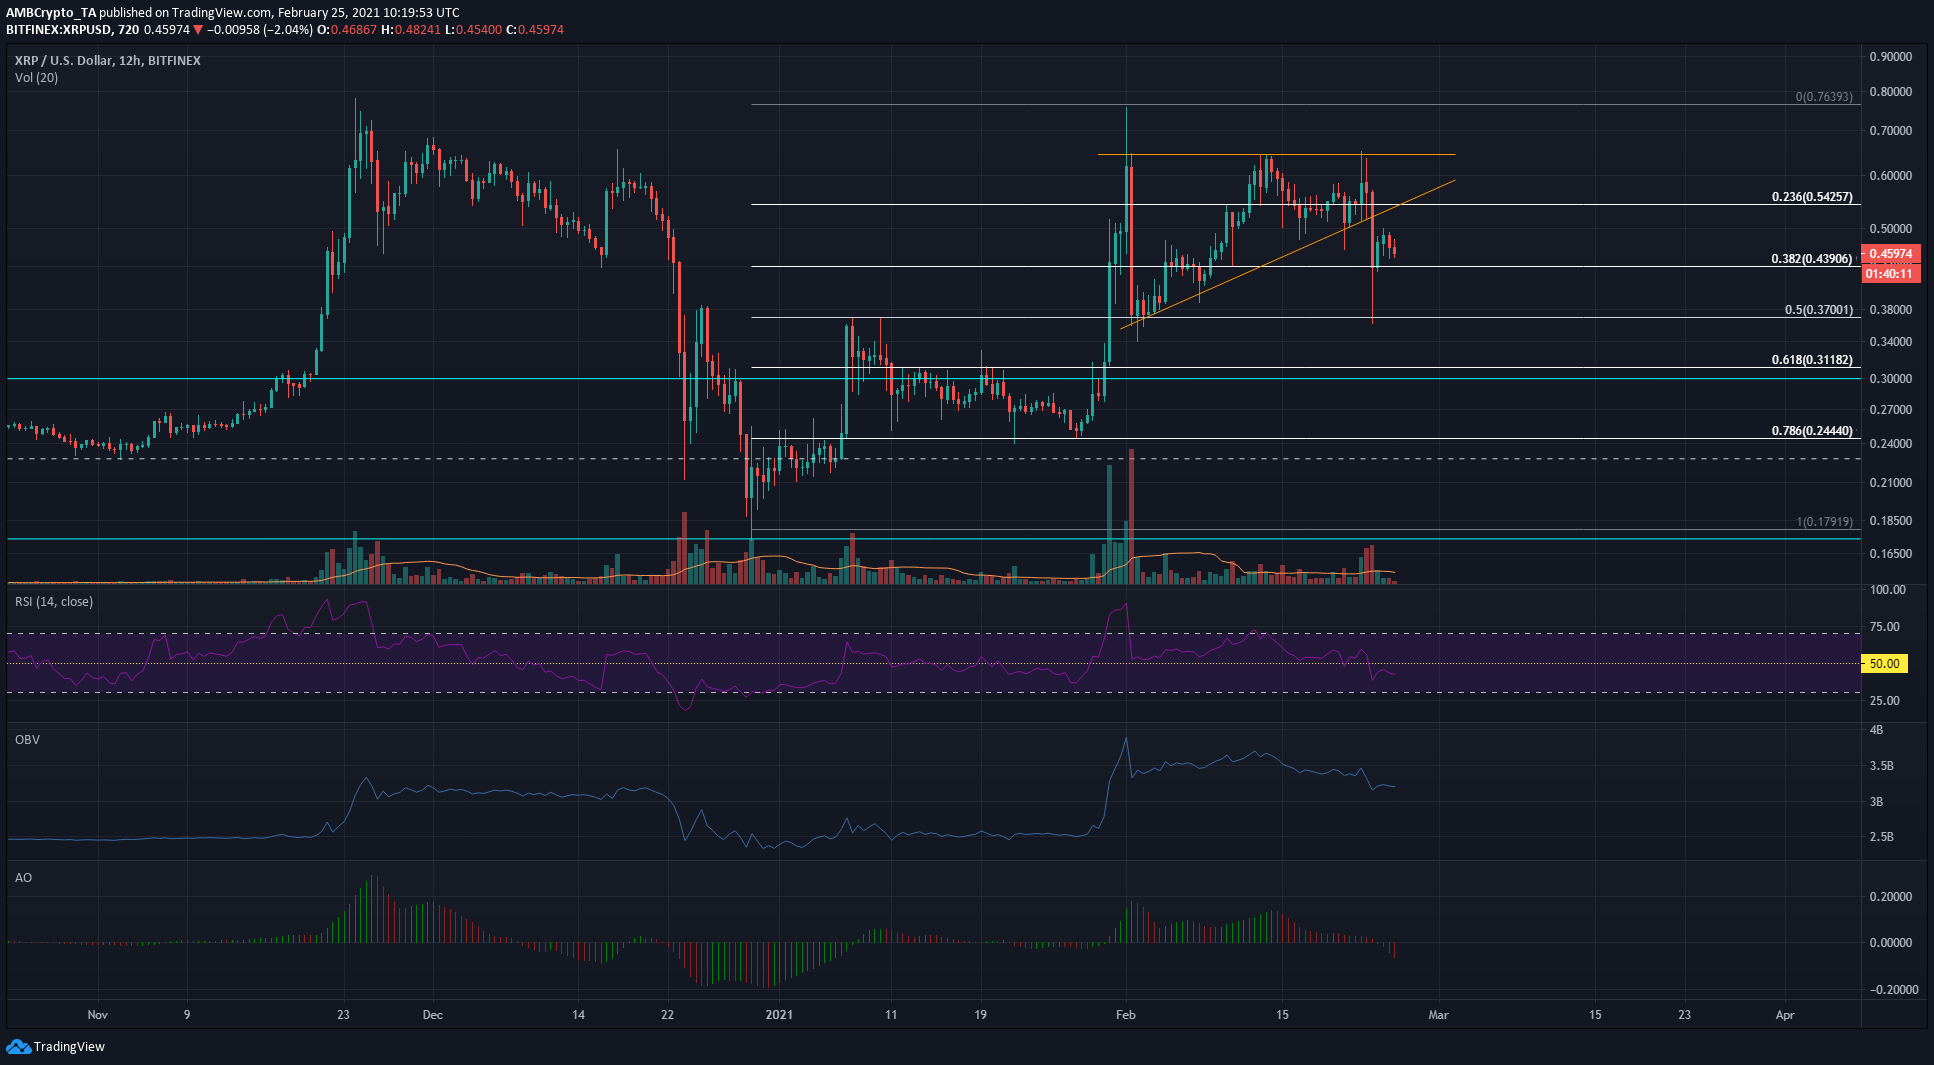
Source: XRP/USD on TradingView
The two things to note are the bearish breakdown of XRP after it formed an ascending triangle – this pattern generally sees the price go on a bullish breakout. However, the drop coincided with Bitcoin’s plunge from near $58k, and XRP could be set to record further losses.
Another thing to note is the weak bounce off the 38.2% Fibonacci Retracement level- while the bounce had some noticeable trading volume, the subsequent sessions saw selling on greater volume, showing that market sentiment was strongly on the bearish side.
Market Rationale
The RSI slipped beneath neutral 50 into bearish territory even as the XRP bounce-off was met some selling pressure at the $0.495-$0.5 region. The Awesome Oscillator also formed a bearish crossover to denote rising downward momentum.
Trading volume has been touched upon previously and is an important piece of evidence that showed that sellers were in control of the market.
The OBV has been steadily trending lower over the past couple of weeks, although it was not quite enough to match the buying volume that saw XRP rocket past the $0.3 level of resistance in late January.
Levels to watch out for
The $0.43 is an imminent level of support that is likely to give way to bearish pressure and be flipped to one of resistance. Taking a look at the shorter timeframes, the $0.455 has held reasonably well as support over the past few days. Hence, a dip beneath these two levels is an early indication of further bearish pressure for XRP.
Losing the $0.43 level would likely see XRP move toward $0.37, where bulls might be able to step in and halt further losses as it represents the 50% retracement level.
Conclusion
The short-term outlook for XRP was bearish while the longer timeframes also began to show signs of the market swaying in favor of the bears. Over the next week or two, the $0.37 mark could represent a buying opportunity to look out for.


![Why Chainlink [LINK] and Polygon [MATIC] are more similar than you realise](https://ambcrypto.com/wp-content/uploads/2024/04/Chainlink_and_Polygon-1-400x240.webp)

