XRP, Tron, Synthetix Price Analysis: 28 February

After Bitcoin lost out on the $45,000 mark, the broader market witnessed another sell-off and most altcoins registered losses in the last 24 hours. Such was the case with XRP, Tron, and Synthetix, which traded close to their respective support levels at the time of writing.
XRP
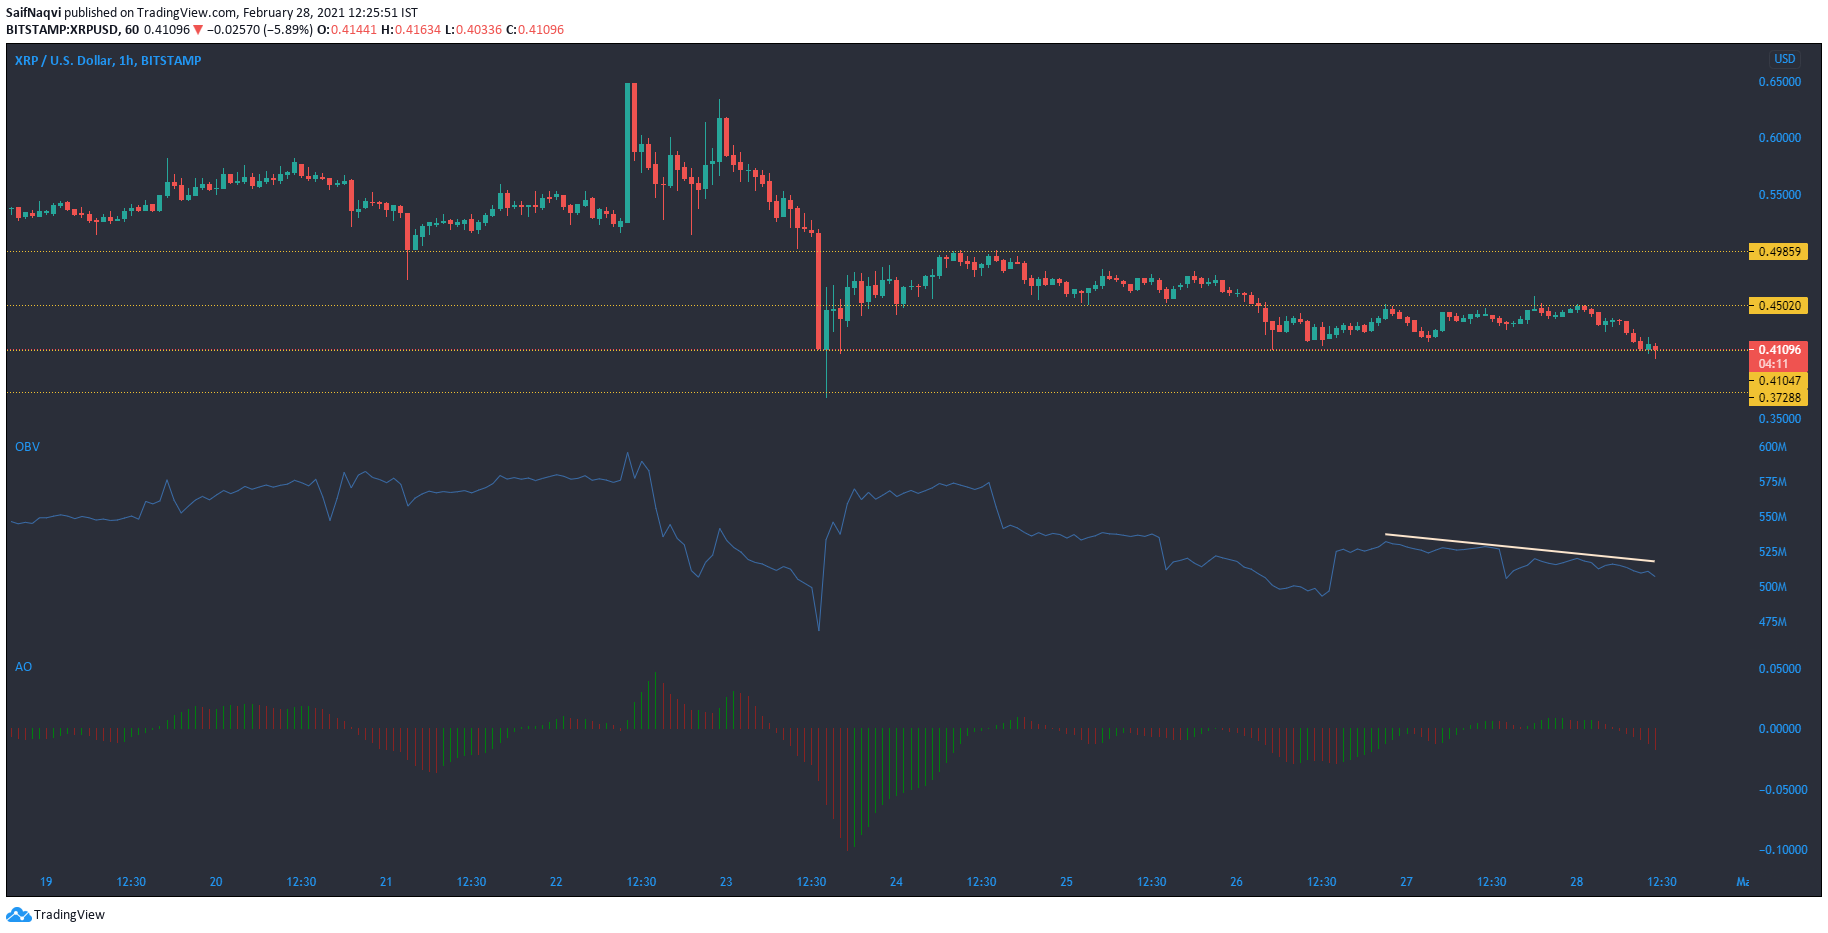
Bulls were unable to recover XRP above the $0.45 resistance mark and the price moved lower after each attempt on the hourly timeframe. At the time of writing, XRP floated just above a crucial support level at $0.41 level, a level that was reached during Bitcoin’s pullback from over $58,000 nearly a week ago.
The On Balance Volume formed lower lows and explained that the lack of buying pressure prevented bulls from breaching the $0.45 level. The Awesome Oscillator’s red bars moved below the half-line as momentum rested with the sellers. An extended sell-off would present the next support level at $0.37.
Tron [TRX]
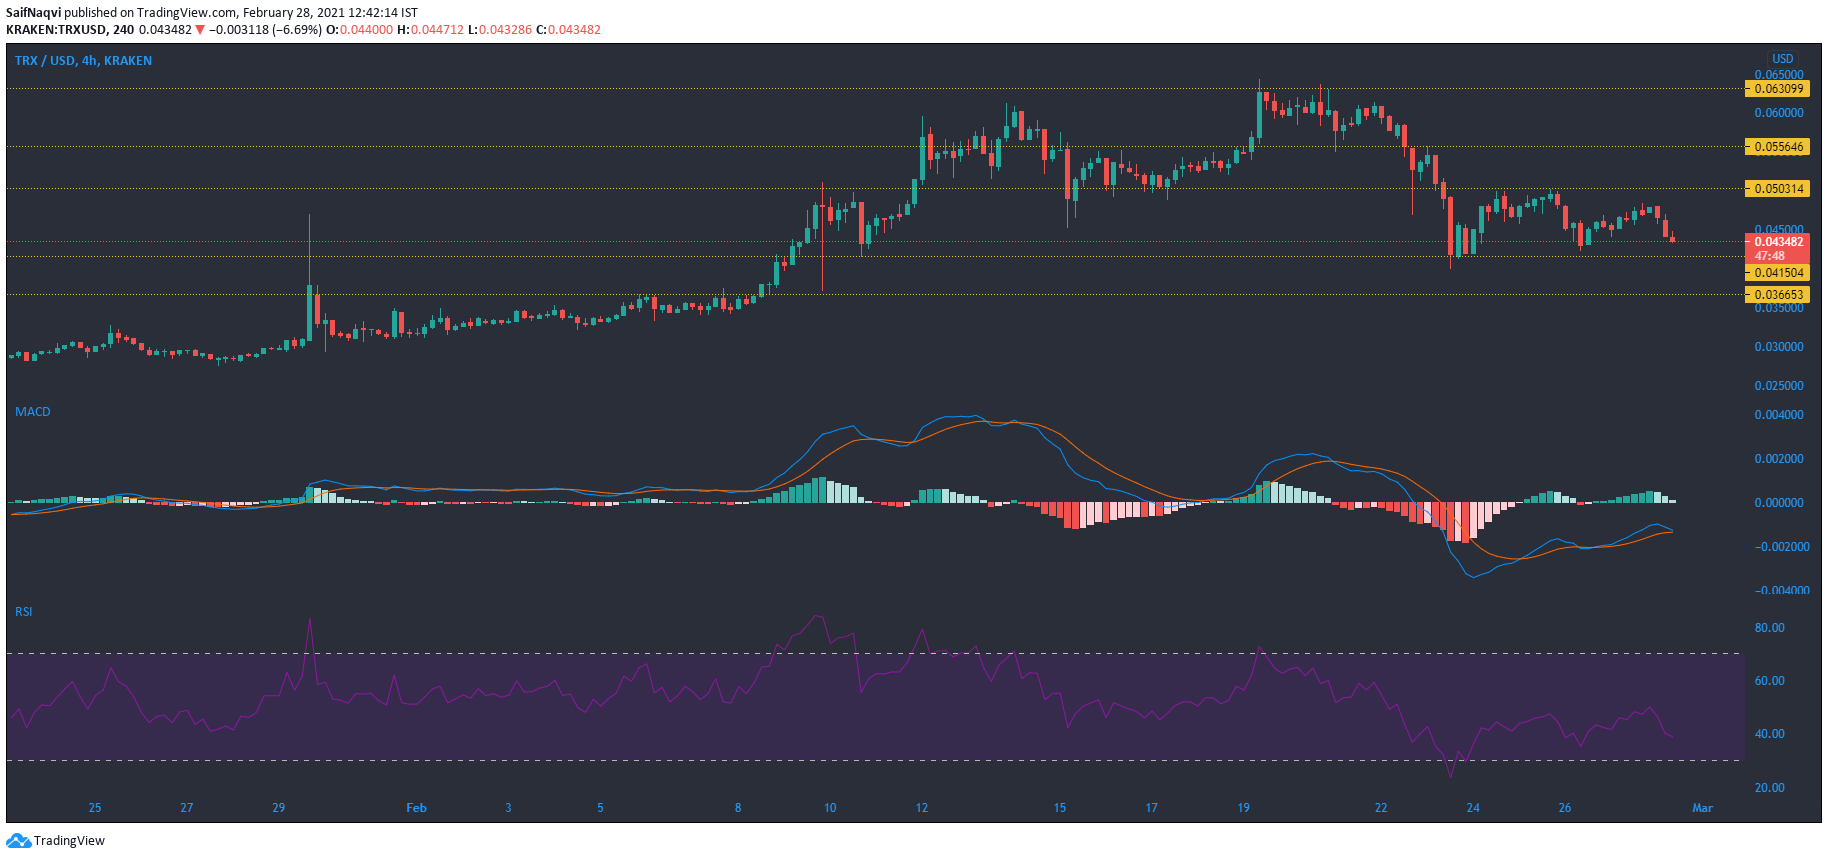
Much like XRP, Tron also moved into the red territory at press time after the price retraced by over 6% in the last 24 hours. The price moved towards a strong region of support at $0.041 after consecutive red candlesticks appeared on its 4-hour chart. The indicators flashed bearish signals and the aforementioned support line could be threatened over the next few sessions.
The MACD closed in on a bearish crossover, while the bars on its histogram looked to move below the zero-line. The RSI pointed lower from around the 40-mark. More weakness in the broader market could have a negative effect on TRX and the $0.036 level could be tested if the price was to move below the press time support.
Synthetix [SNX]

A look at the 4-hour charts on Synthetix showed that the cryptocurrency struggled to sustain its highs seen during mid-February. Since reaching an all-time high at over $28, a correction took SNX below its 200-SMA (green) and the price has failed to recover. Over the past few days, SNX’s movement was largely restricted between $19.67 and $17.17 as neither side found the momentum to initiate a breakout on the charts.
The Stochastic RSI pointed north after a bullish crossover in the lower region. This indicated that a move below the press time support could be negated by the bulls. The CMF showed that SNX has reacted strongly to the flow of institutional money, and the lack of inflow has added more weakness to its price.