These factors are now a bottle-neck for Chainlink’s price

Chainlink registered a 27% decline over the past week, marking its largest correction since its 48% drop during the 2nd week of March 2020. While the entire market was a victim of the recent bearish dump, major altcoins have indicated signs of recovery in the past few days.
For Chainlink, the situation was a little different but recent data suggested LINK has come a long way in the past 6 months.
Chainlink Wallets rise from 183k to 400k
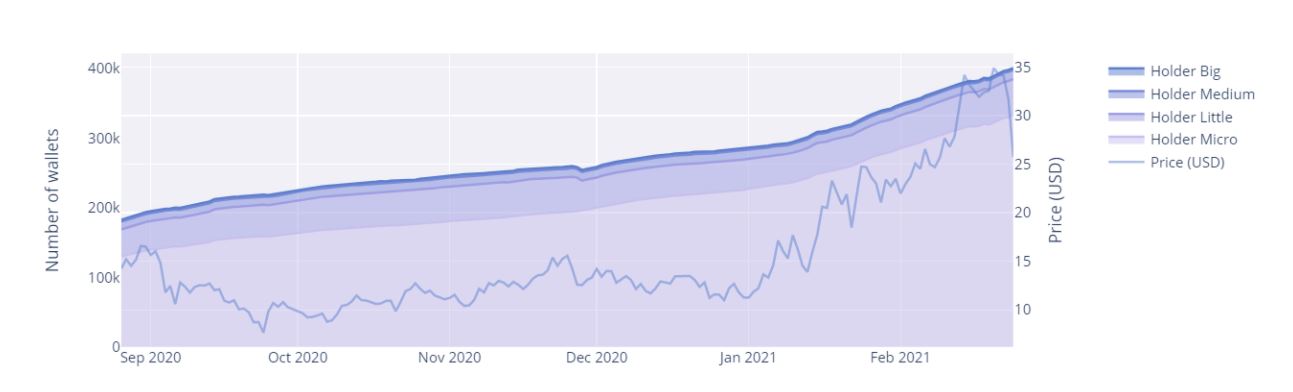
According to data from Our Network report, Chainlink has witnessed a wallet growth of 118.5% over the past 6 months, with hodlers holding at least 1 token on their addresses. It was also reported that the overall on-chain volume had reached a renewed all-time high after the asset registered weekly on-chain flows of $3.8 billion. The average transaction was valued at about $30k.
Investors moving into LINK have consistently added on a weekly basis, adding 15k to 30k regularly.
After the recent collapse, AMBCrypto also reported that Chainlink was finding bullish momentum to trigger a constructive recovery but over the past 24-hours, some of the on-chain metrics indicated signs of caution.
Active Addresses, Number of Transfers hit monthly lows
Over the course of 2020, Chainlink has remained relevant in the market due to its consistent activity in the industry, in terms of development and transactions. However, glassnode reported that over the past week, the number of Chainlink Transfers has reached a monthly low of 663.857.
Similarly, the number of receiving addresses was reaching a low as well, indicating that users were currently showing a lack of operations.
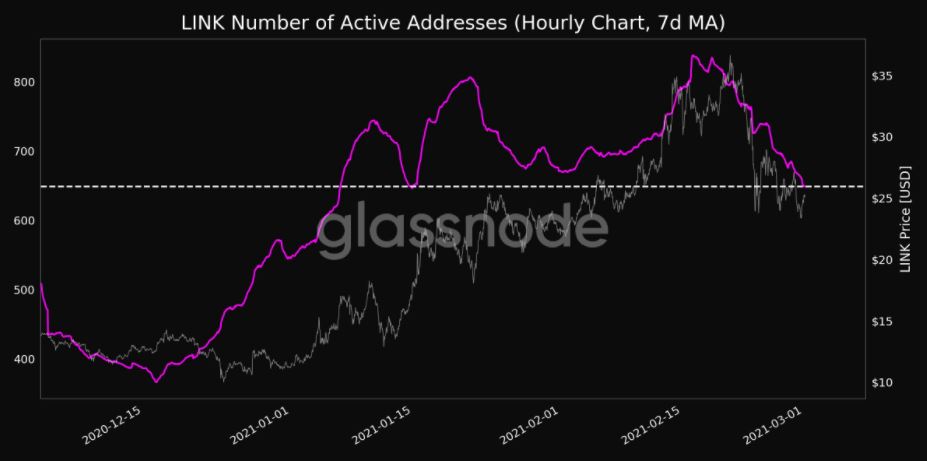
However, the major concern remains the drop in active addresses. While popular assets also witness declining active addresses during a price drop, the recent depreciation has been more prominent than before, which is currently hindering LINK’s recovery.
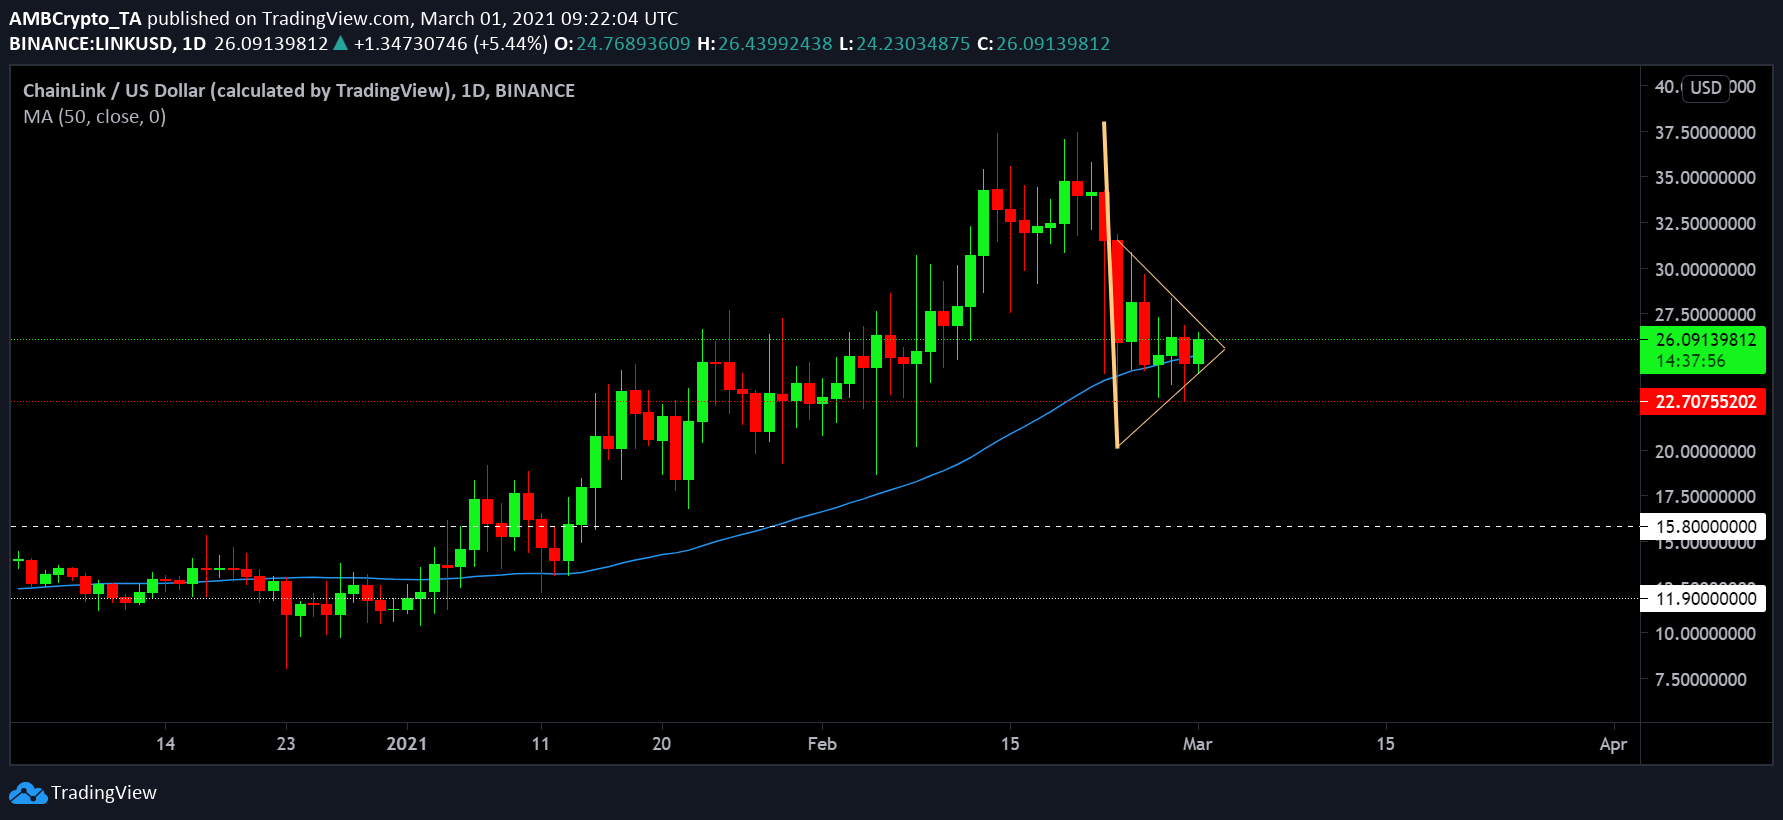
As illustrated in the above chart, LINK’s daily chart is currently projecting the formation of a bearish pennant, that may undergo another correction. The support at $22.70 should hold, otherwise, the market may witness a position below $20 again in the future.

![Aerodrome [AERO] had its moment](https://ambcrypto.com/wp-content/uploads/2026/06/Abdul-2026-06-22T084432.364-e1782114380197.webp)