Ethereum, Dogecoin, XRP Price Analysis: 11 May

Ethereum’s bearish signals could materialize into a correction and the first support mark lay around $3,810-$3800. Dogecoin cut losses at $0.44 but this area would need to be defended over the coming days as well. Lastly, XRP neared $1.31-support and a breakdown could go as low as $0.91.
Ethereum [ETH]

Source: ETH/USD, TradingView
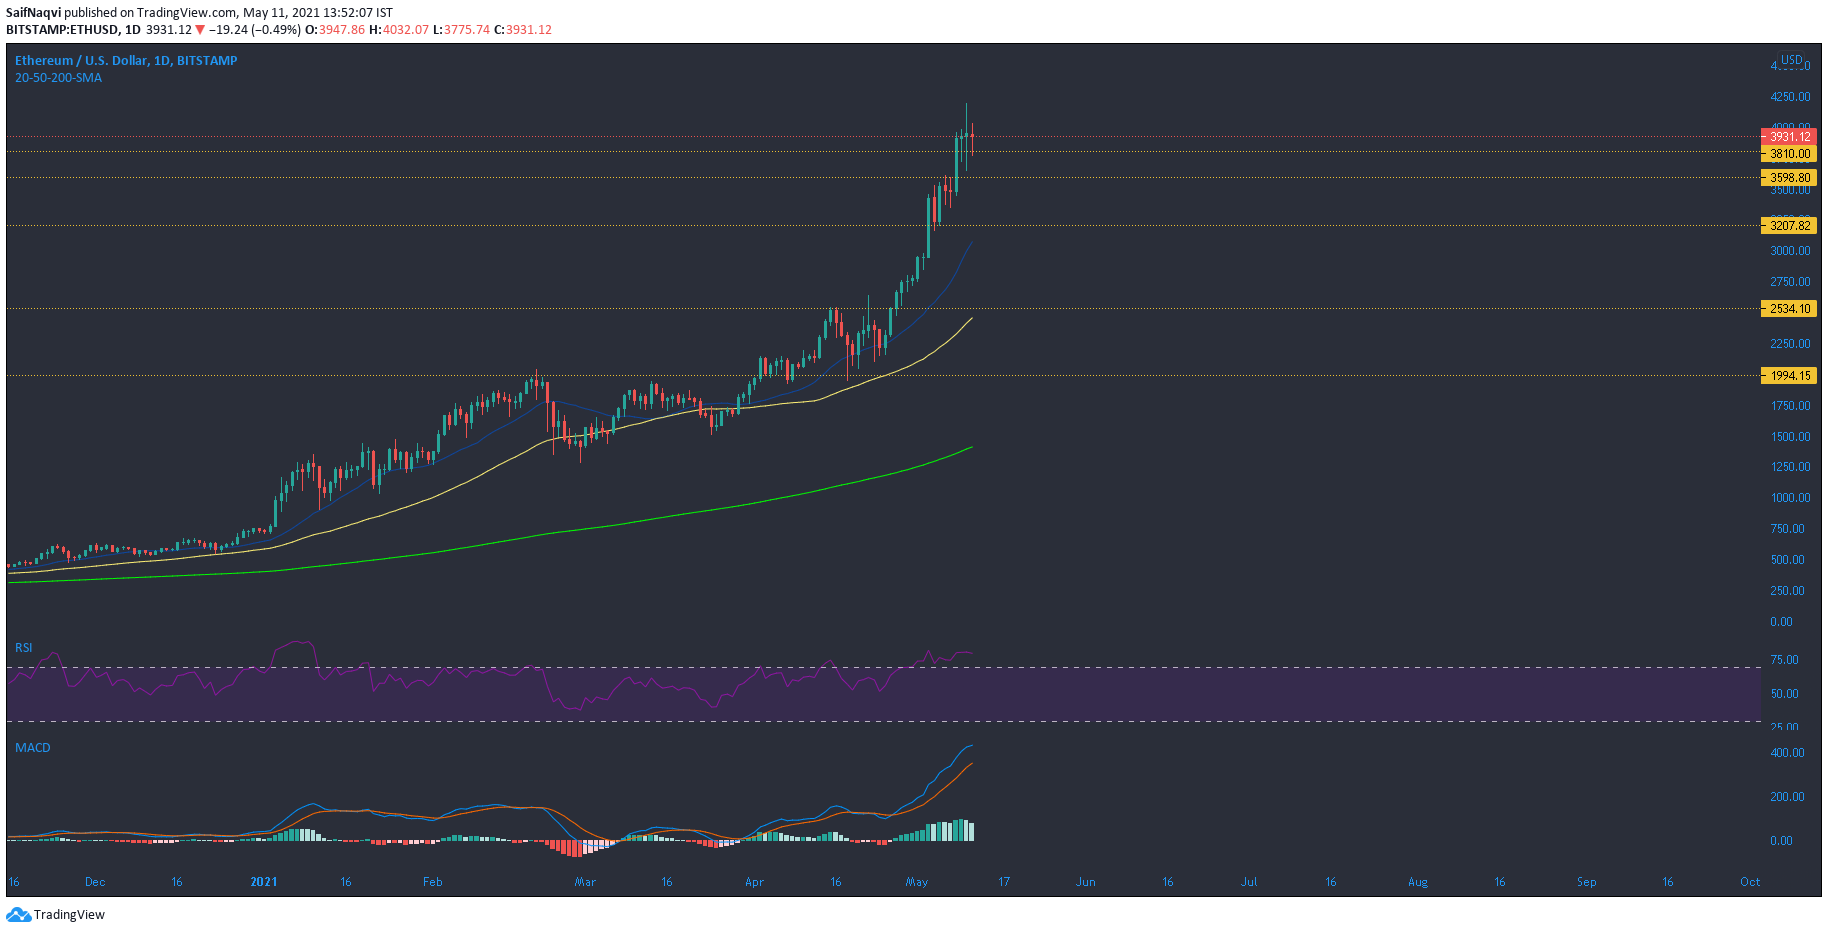
Since late April, Ethereum’s price jumped from $2,166 to a high of $4,200, while corrections have been few and far between. However, the appearance of a consecutive doji candlestick on the daily timeframe caused created some skepticism in ETH’s most recent rally. In fact, warning signals have been present in the market for the past few days and while buying pressure has kept up despite these signs, a correction might finally be around the corner.
On the 4-hour timeframe, consecutive red candlesticks saw ETH dip closer towards $3,800-support. Additional levels of support lay around $3,560, $3,200 and a sharper sell-off could go as low as $2,530 – a region that coincided with the 50-SMA (yellow). RSI was yet to dip from the overbought region – indicative of an incoming price correction. MACD line was well above the Signal line, but its histogram noted some weakening momentum.
Dogecoin [DOGE]

Source: DOGE/USD, TradingView
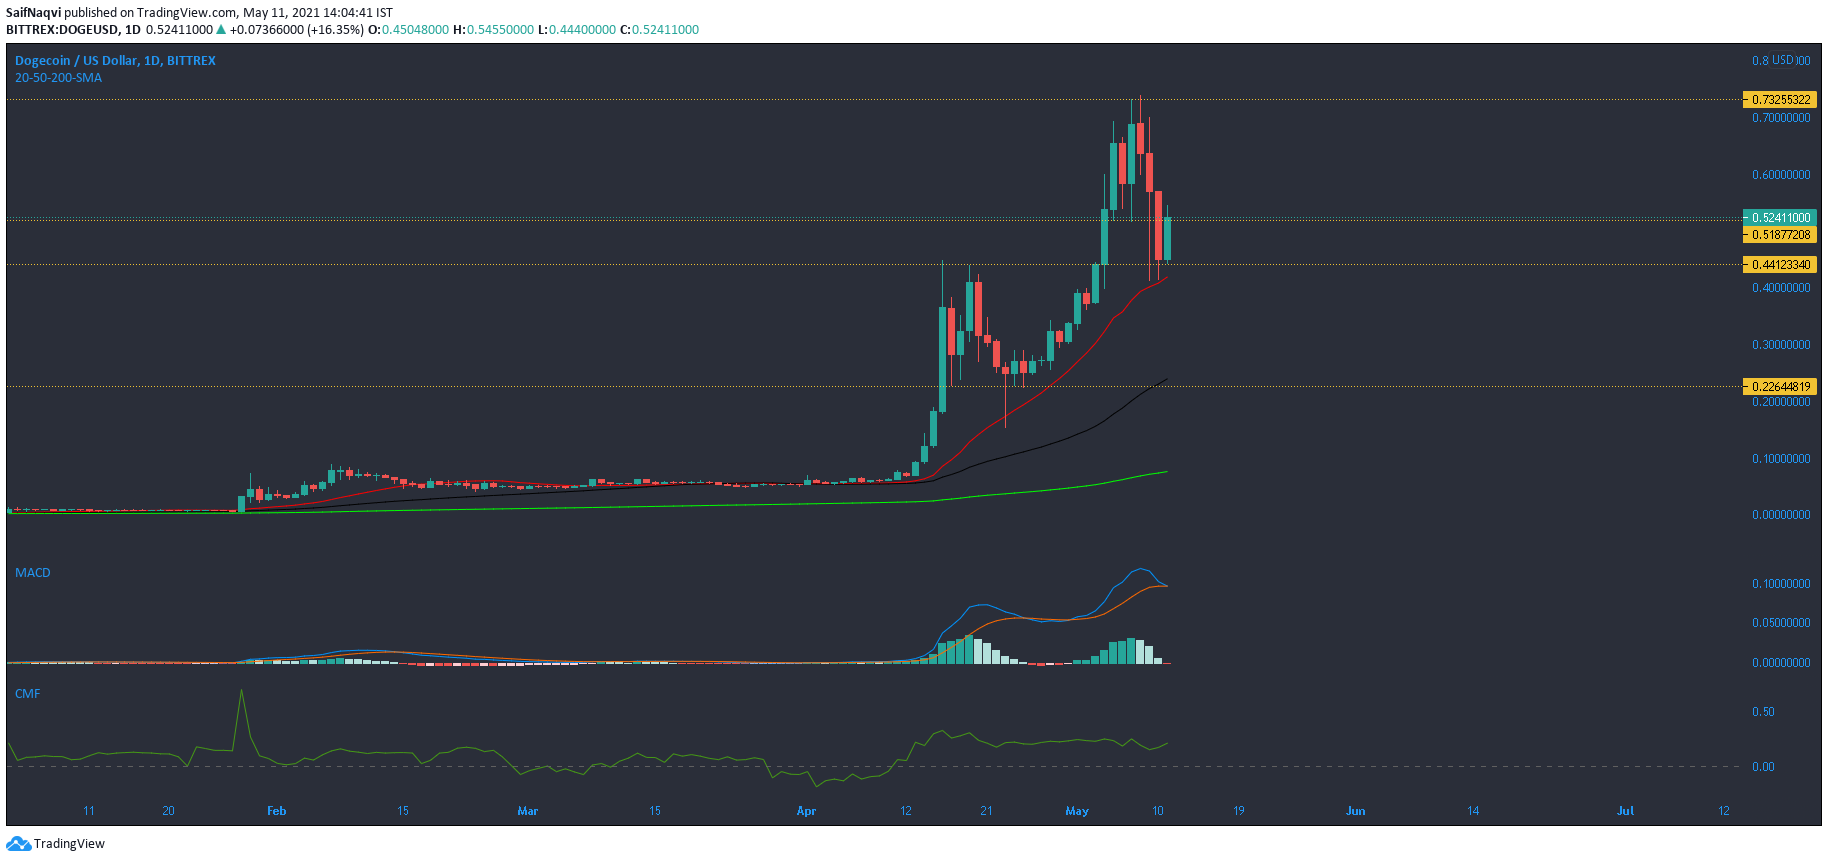
Dogecoin cushioned its losses at $0.44-support but some indicators still pointed towards weakness in the market. MACD was close to a bearish crossover. If the present support counters bearish presence over the coming days, DOGE would have established a reliable line of defense at $0.44. This would likely lead to a round of consolidation as DOGE prepares for its next upswing.
A break below $0.44 could go as low as $0.226 (50-SMA). Despite a sharp decline in trade volume, the flow of institutional capital remains healthy for Dogecoin. This was highlighted by Chaikin Money Flow as it maintained above the half-line.
XRP

Source: XRP/USD, TradingView
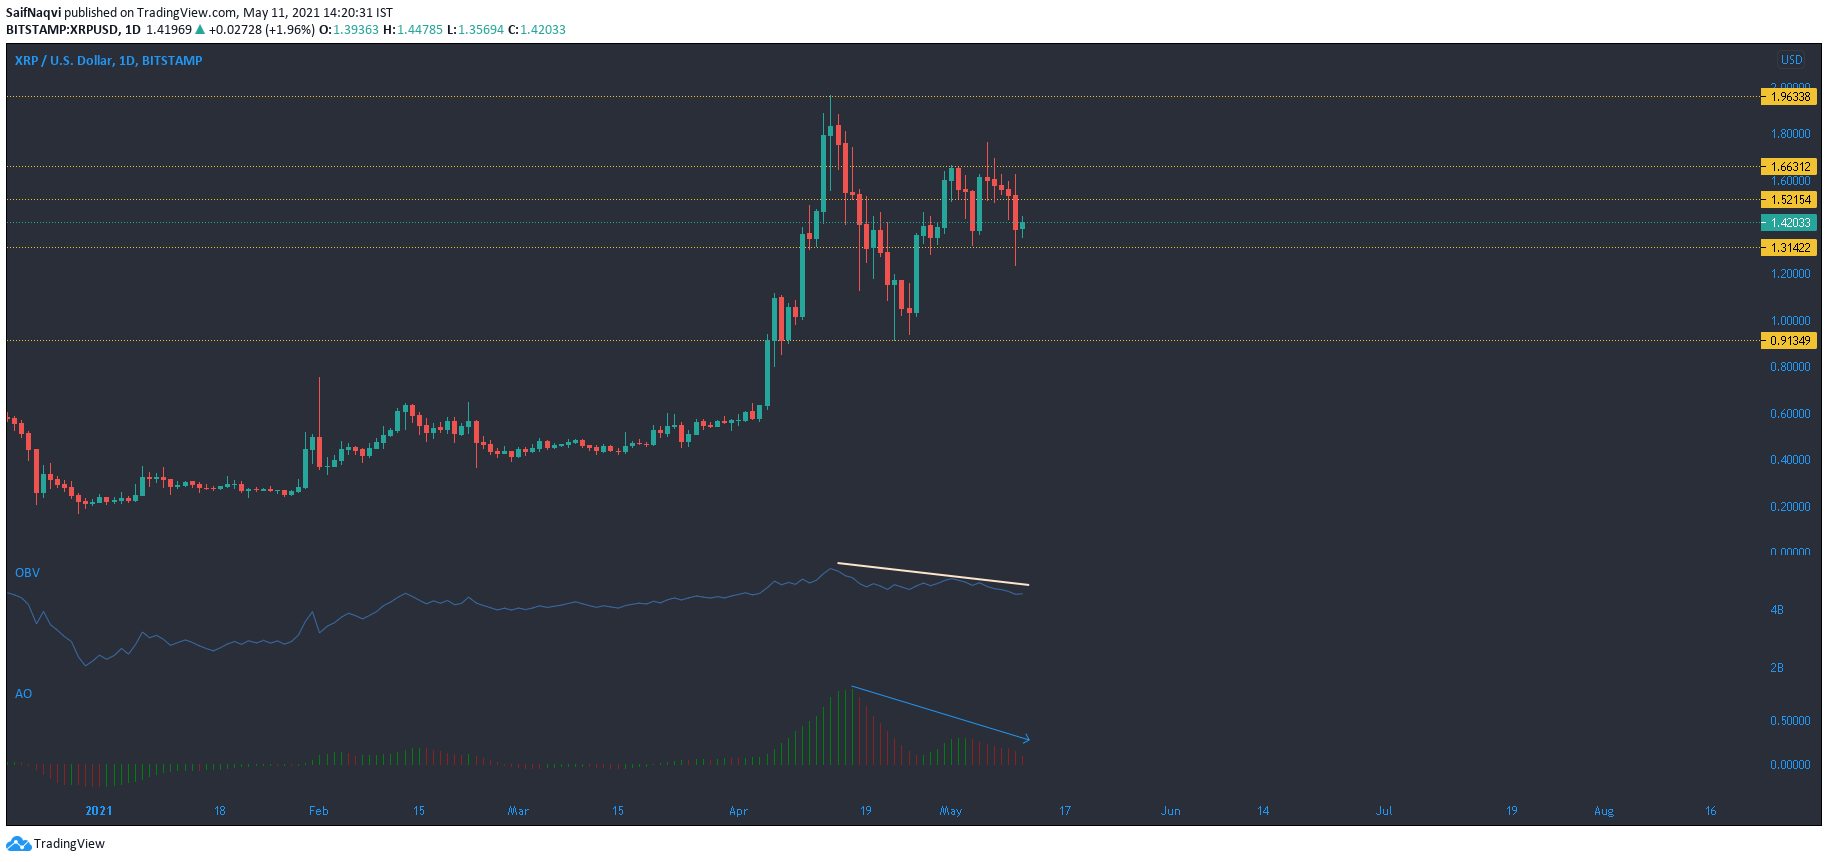
With regard to XRP, the 50-SMA floated around $1.14 and a dip below this point could lead to another round of sell-off. After steadily rising since early January, OBV started to decline from April 15. A downturn in buying pressure indicated that investors have been taking profits. If this continues over the week, XRP could dip below $1.14 and all the way towards $0.91 before buyers step in.
Awesome Oscillator formed a bearish twin peak- setup that usually sides strongly with the sellers. For a bullish comeback, levels to recapture include $1.52 and $1.66. This could lead to a jump towards the $2-mark.

![Uniswap [UNI] price prediction - Traders, expect THIS after altcoin's 14% hike!](https://ambcrypto.com/wp-content/uploads/2024/12/UNI-1-400x240.webp)


