Litecoin Price Analysis: 17 May

The Bitcoin price faced strong volatility due to which the price has once again crumbled under $50k. This strong volatility has spread to the altcoin market and the digital silver, Litecoin [LTC], was among those alts affected. The Litecoin price slipped by 21% over the weekend and was trading at $286 with a market capitalization of $18.97 billion.
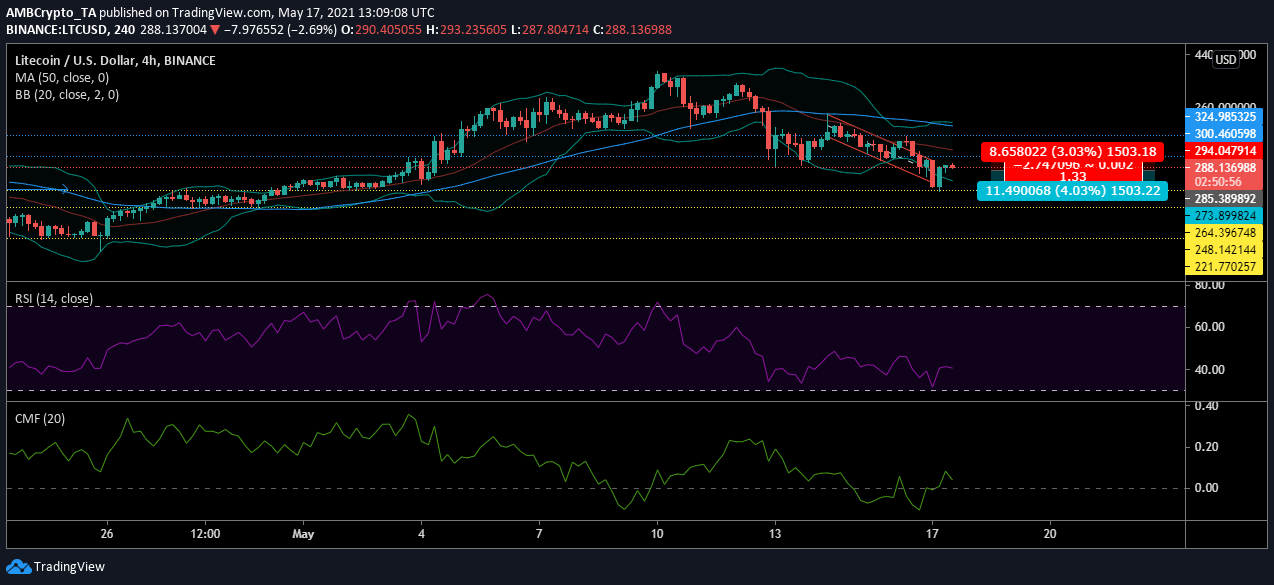
Litecoin four-hourly chart

Source: LTCUSD on TradingView
The above chart of LTC shows the strong upward march of the digital asset to $413.65 this month, after which began its descent. The coin has now slipped by almost 30% and was seeing a bearish pressure. This bearishness could result in its value stumbling further.
Reasoning
The market was open to more volatility and this was indicated by Bollinger Bands. The divergence of the bands was suggesting that the price has been moving more rapidly than before and may continue to do so. Meanwhile, the signal line was hovering above the candlesticks highlighting the downward trending price.
The rise in selling pressure has pushed the digital asset lower and as per the relative strength index, this selling pressure was rising. RSI value had briefly hit 30, which is the oversold zone. However, a recovery pushed the indicator’s value higher. Now that the selling pressure continued, RSI has been moving towards the oversold zone again.
The money which momentarily made its way into the market might seep out. Chaikin Money Flow suggested that new money was entering the market with the recent recovery.
Crucial levels
Entry-level: $285.38
Take Profit: $273.89
Stop-level: $294.04
Risk to Reward: 1.33
Conclusion
The current Litecoin market was suggesting the rise of bearishness in the market. As LTC’s value moved close to $286, the selling pressure was visibly dominant and the traders might want to tread carefully.


