Bitcoin Cash, Filecoin, MATIC Price Analysis: 04 June

With Bitcoin losing ground on the $38,000-level, bearish sentiment had returned to the global cryptocurrency market. Altcoins such as Bitcoin Cash and MATIC registered losses amid low volatility. On the other hand, Filecoin sustained its foray into the green zone, but some selling pressure was noted around the $95-resistance.
Bitcoin Cash [BCH]

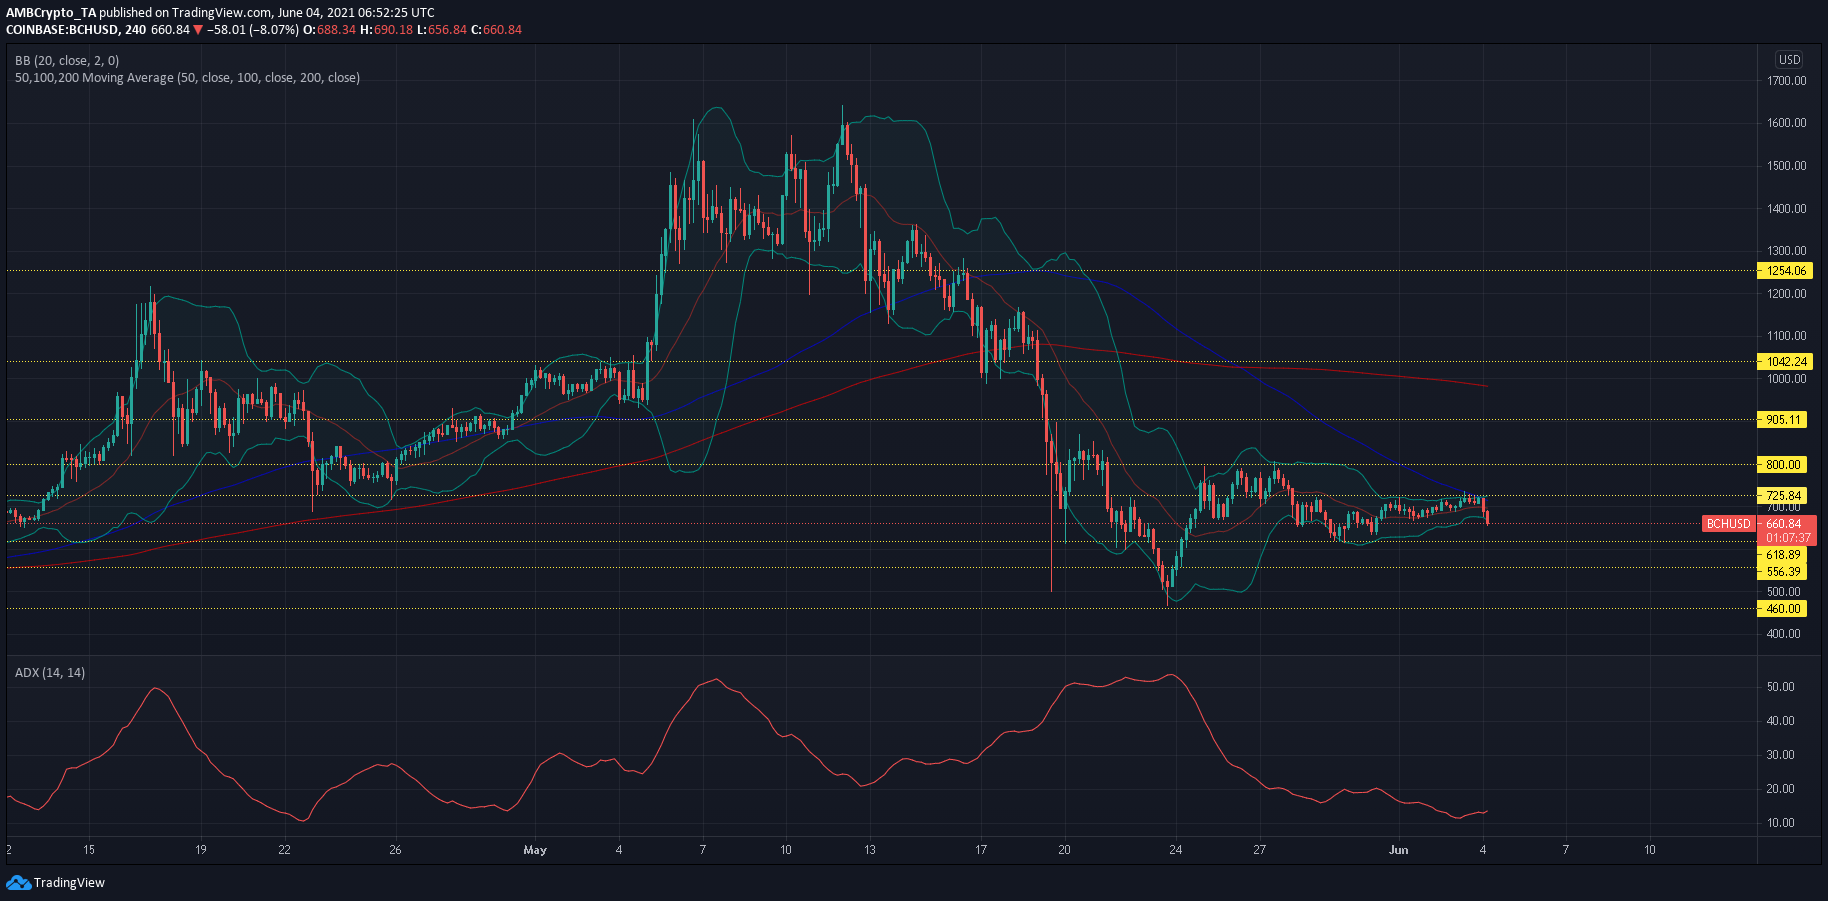
Source: BCH/USD, TradingView
Although Bitcoin Cash dropped by 6% over the last 24 hours on the back of a broader market correction, the cryptocurrency maintained its channel between $620-$720. A look at BCH’s 4-hour chart showed a lack of volatility over the past week and the same was highlighted by the constricted nature of the Bollinger Bands. A rise in volatility could see BCH head back towards the demand zone between $460 and $556, where an extended sell-off would likely be countered.
A bullish outcome would require BCH to first break above its 100-SMA (blue). Such a development could allow for a hike towards $900.
The ADX pointed north from 13 and suggested that a strong trend was in the making. A hike above 25 would likely see volatility return to the Bitcoin Cash market.
Filecoin [FIL]

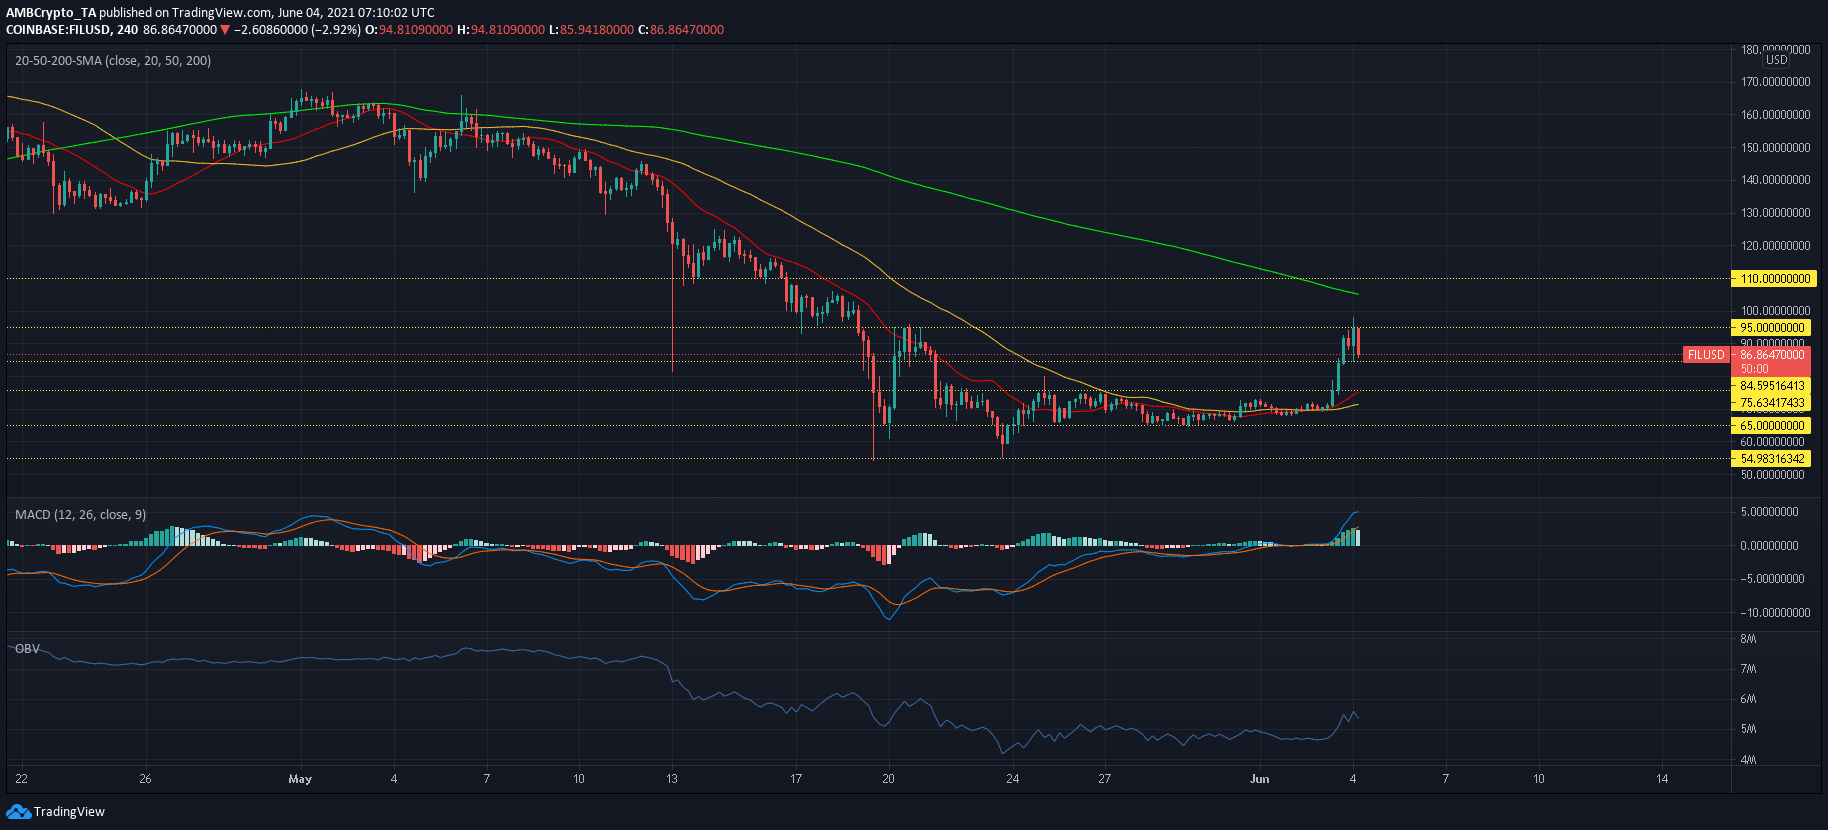
Source: FIL/USD, TradingView
After a period of consolidation that lasted from 24 May to 3 June, Filecoin initiated a breakout above the $77.3-resistance. However, gains seemed to be limited around the $95-level. Nevertheless, the cryptocurrency maintained gains of 21%, compared to yesterday. The next few sessions would provide more clarity of FIL’s current rally. A retest of the $85-support could allow FIL to bounce back and resume its upwards trajectory, whereas a breakdown could drag FIL back towards the $75-support and 20-SMA (red).
While the MACD line maintained its distance from the Signal line, the histogram noted weakening bullish momentum. A bearish crossover could see FIL dip further over the coming sessions. According to the OBV’s movement since 24 May, selling pressure has been maintained for the past week and while a wave of buying pressure could be incoming, the broader market correction could stall such an outcome.
MATIC

Source: MATIC/USD, TradingView
MATIC was holding a channel of $1.75-$1.98 for the past few days, but a breakdown was seen later on its chart. Now down by 12% over the last 24 hours, MATIC headed towards a support line around $1.48-$1.51 – A region bolstered by the 200-SMA (green). Buyers could return at this point and counter selling pressure, but failing to do so would call into action support lines at $1.24 or even $0.96. Bearish momentum was evident on the Squeeze Momentum Indicator, but volatility was still low in the market for steeper losses.
The RSI nosedived to the oversold region and a bounceback can be expected moving forward.


