Bitcoin, Solana, MATIC Price Analysis: 08 June

Bitcoin’s retracement towards $32,000 had a domino effect on the global cryptocurrency market. Altcoins such as Solana and MATIC seemed to be in free-fall as focus shifted to various support lines on each of their respective charts.
Bitcoin [BTC]

Source: BTC/USD, TradingView
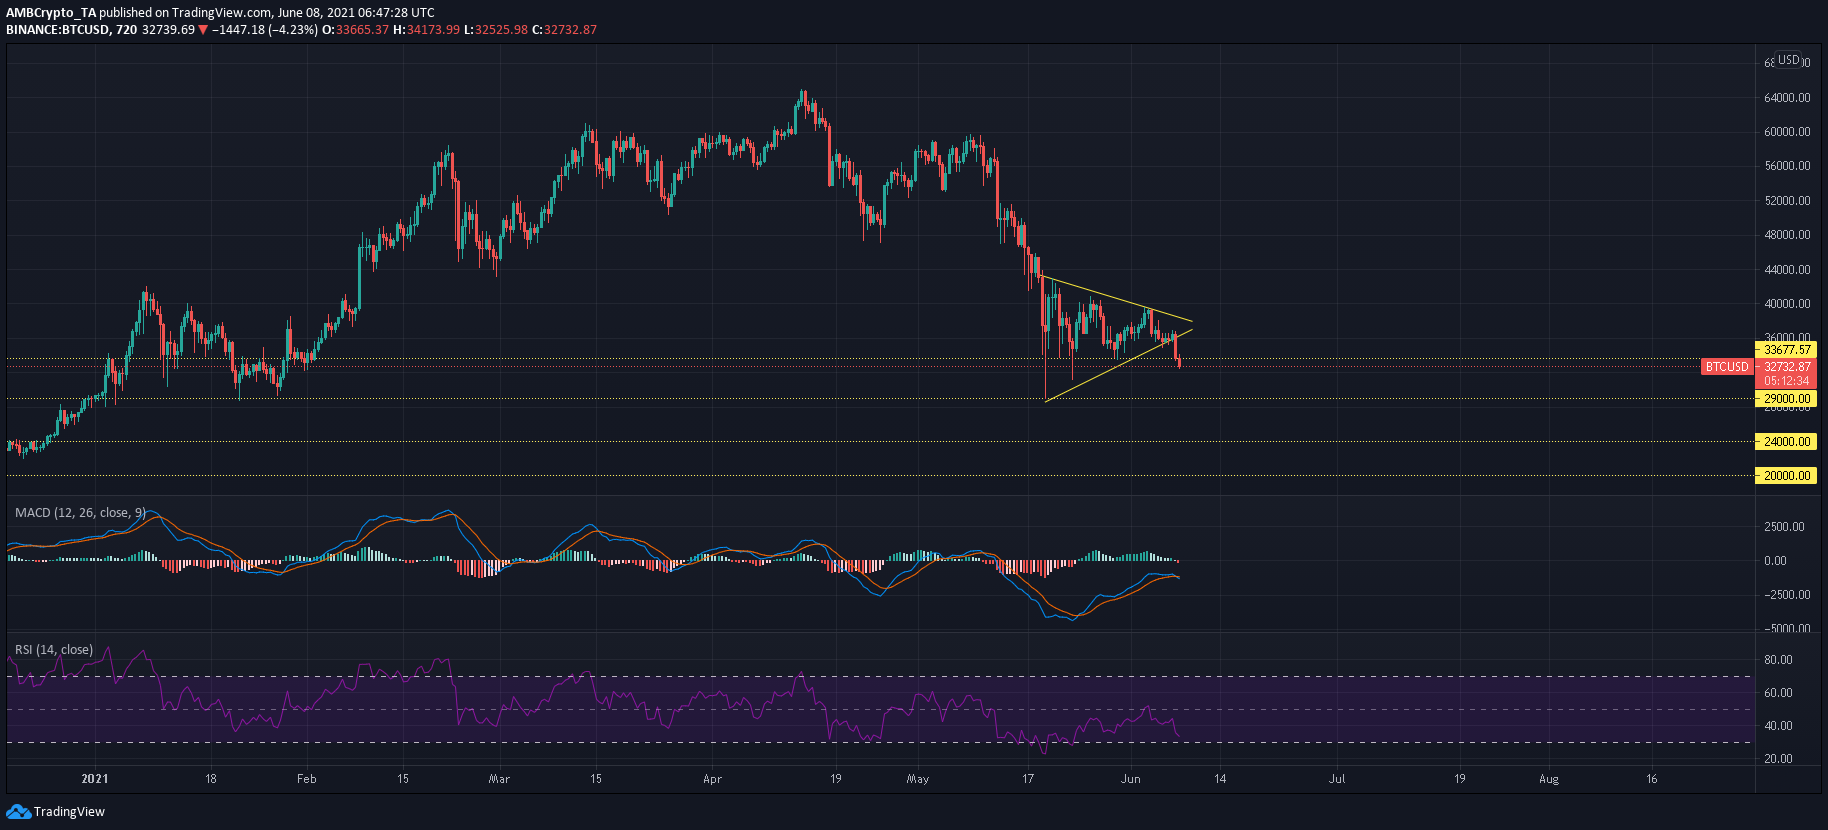
Bitcoin’s price has been in a vulnerable position throughout the last week. The king coin has failed to hold on $41,000, $39,500 and more recently, the $38,000 range. While BTC has been finding higher support levels in the process, a symmetrical triangle breakout was most likely going to tip in favor of the bears as the preceding trend was bearish. Moving forward, BTC must find support between $28,000 and $30,000 as a breakdown could trigger a more cascading sell-off. A fall towards $20,000 could become a reality in such a situation.
MACD now showed a bearish crossover as the Fast-moving line fell below the Signal line. RSI headed towards the oversold zone and while a bounce-back can be expected from the bottom zone, it would likely maintain bearish territory. Many are speculating that recent comments made by former U.S. President Donald Trump against Bitcoin may have led to the most recent pullback.
Solana [SOL]

Source: SOL/USD, TradingView
Solana moved south along with the broader market and was down by 16% over the last 24 hours. On the 4-hour chart, SOL conceded 50% Fibonacci level ($38.77) to the bears, and selling pressure would likely drag the cryptocurrency below 38.2% level ($34.1) as well. A more reliable defense could be found at 23.6% level ($28.32)- a region that earlier served as a resistance line in mid-April.
RSI nosedived towards below 40 after rising steadily over the past two weeks. Interestingly, Awesome Oscillator highlighted a bearish divergence even prior to the pullback.
MATIC

Source: MATIC/USD, TradingView
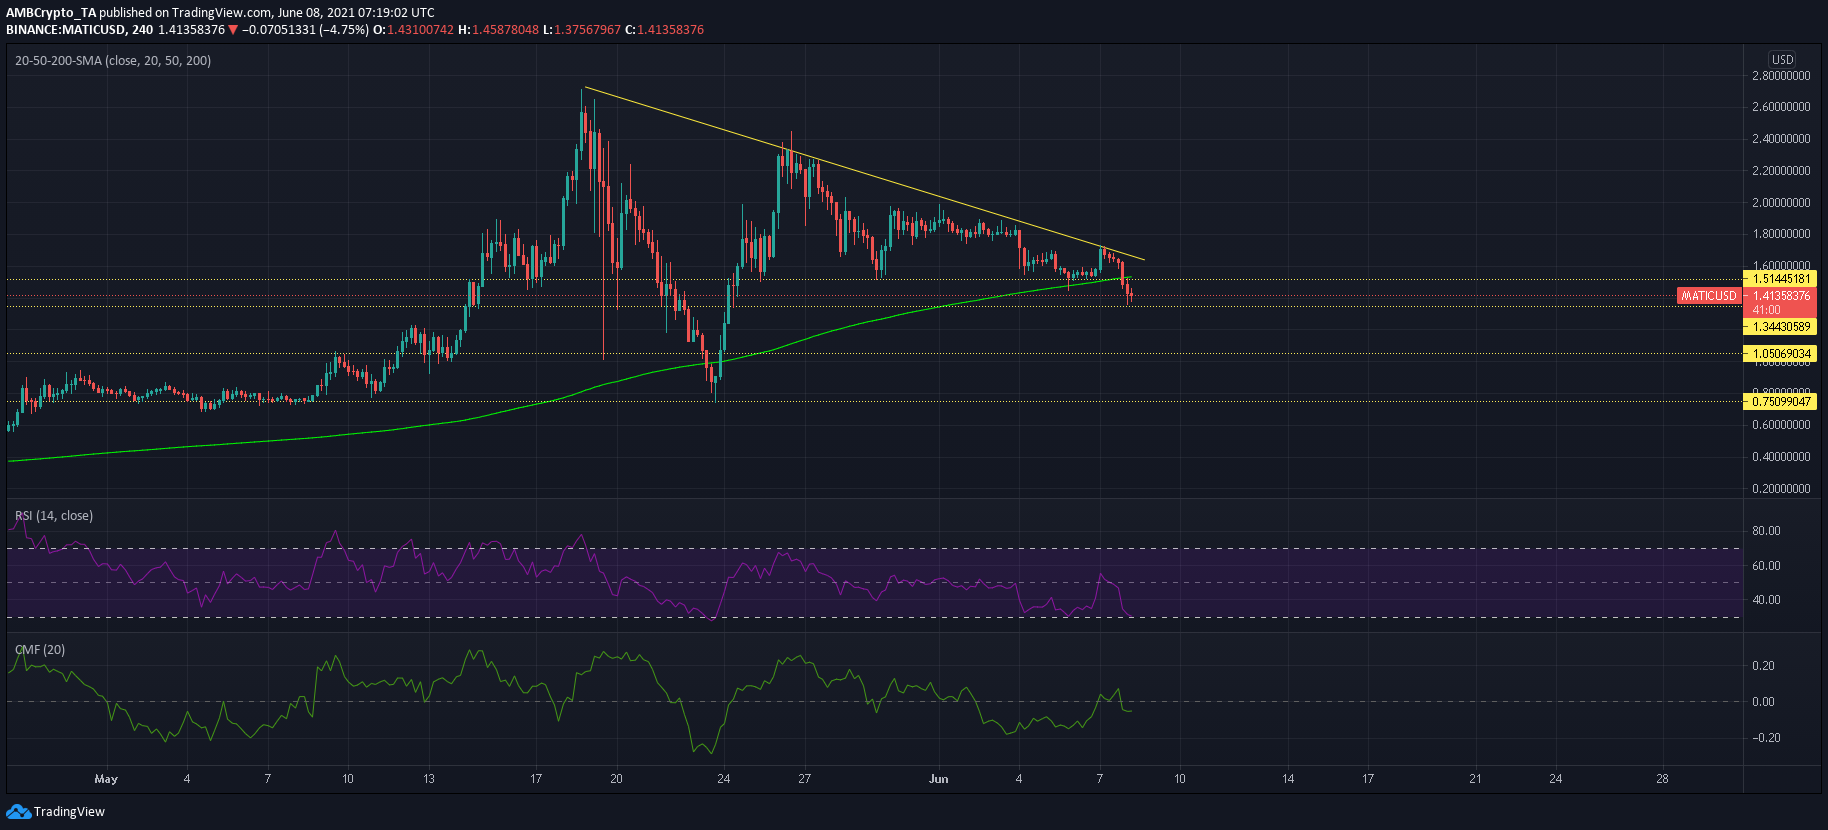
MATIC pierced below a strong defensive line at $1.50 and the candlesticks were now below their 200-SMA (green) on the 4-hour timeframe. Several support areas were highlighted on its 4-hour chart. The first region lay between $1.34 and $1.21. A sharper retracement could see MATIC head towards the $1-mark. Slightly below this area was a demand zone between $0.85-0.75. The extent of selling pressure was difficult to ascertain at this point so it was not clear which level could lead to a bounce back.
According to RSI, price was now oversold but the index could float in this region for a few sessions till the broader market recovers. Adding to MATIC’s woes, capital inflows were weak according to CMF.


