Bitcoin: Could this be a sign that the bear market is ending

The previous week saw various ups and downs for Bitcoin with respect to its on-chain metrics, as well as its price. For the most part, the crypto did not seem to be making many gains. This week alone, BTC made history with multiple indicators while others seemed to be running down the historical path. One particular metric, however, noted some very uncommon movement. Could this be the sign needed to confirm the end of the bear market?
Bitcoin – No longer volatile?
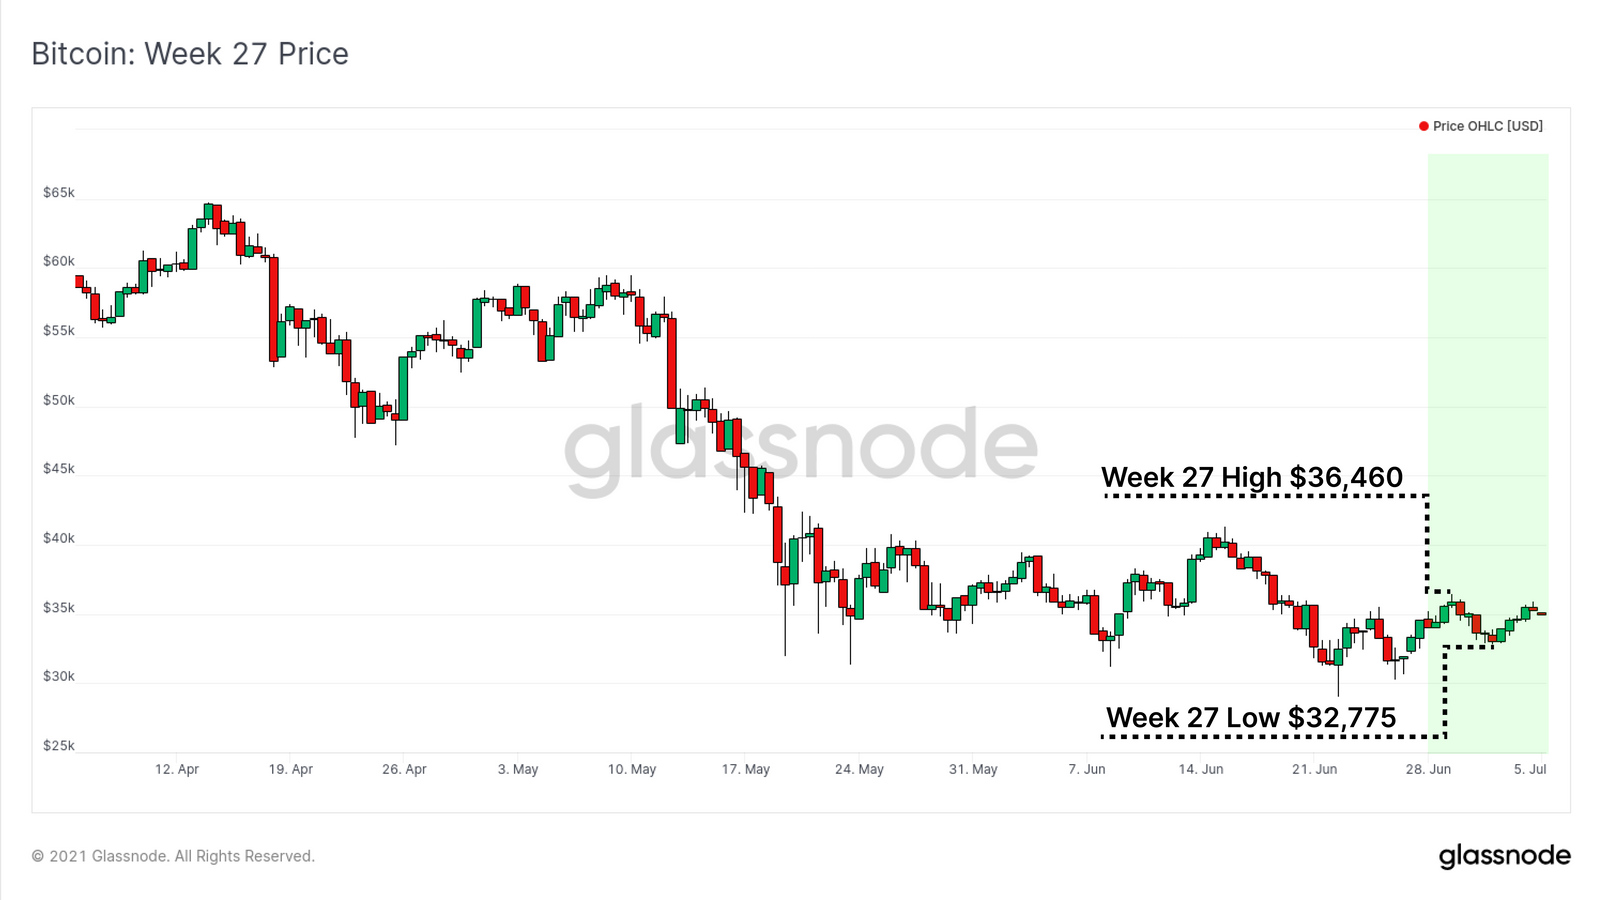
Over the last 7 days, the king coin has consolidated itself within the $32k-$36k range, registering a weekly high of $36,460 and a low of $32,775. This may be an indication that the coin might no longer be volatile and might be entering a period of long-term consolidation. In fact, its effects could be seen on a couple of other metrics as well, particularly concerning the hash rate and mining algorithm.
The Great Migration
The impact of China’s mining ban reached its full swing as Bitcoin observed some pretty significant negative effects. The hash rate took its biggest hit yet for the first time in Bitcoin’s history as the mining time peaked. The Mean Block Interval displays the time taken to mine each block on the blockchain and whenever hashing power goes down, this “time taken” goes up.
This week, on a 24-hour average, the time taken to mine one block touched 32.6 mins or 1958 seconds. This was over 226% longer than the average 600 secs block time. While this is likely to be temporary, it underlined the effects of the great mining migration.
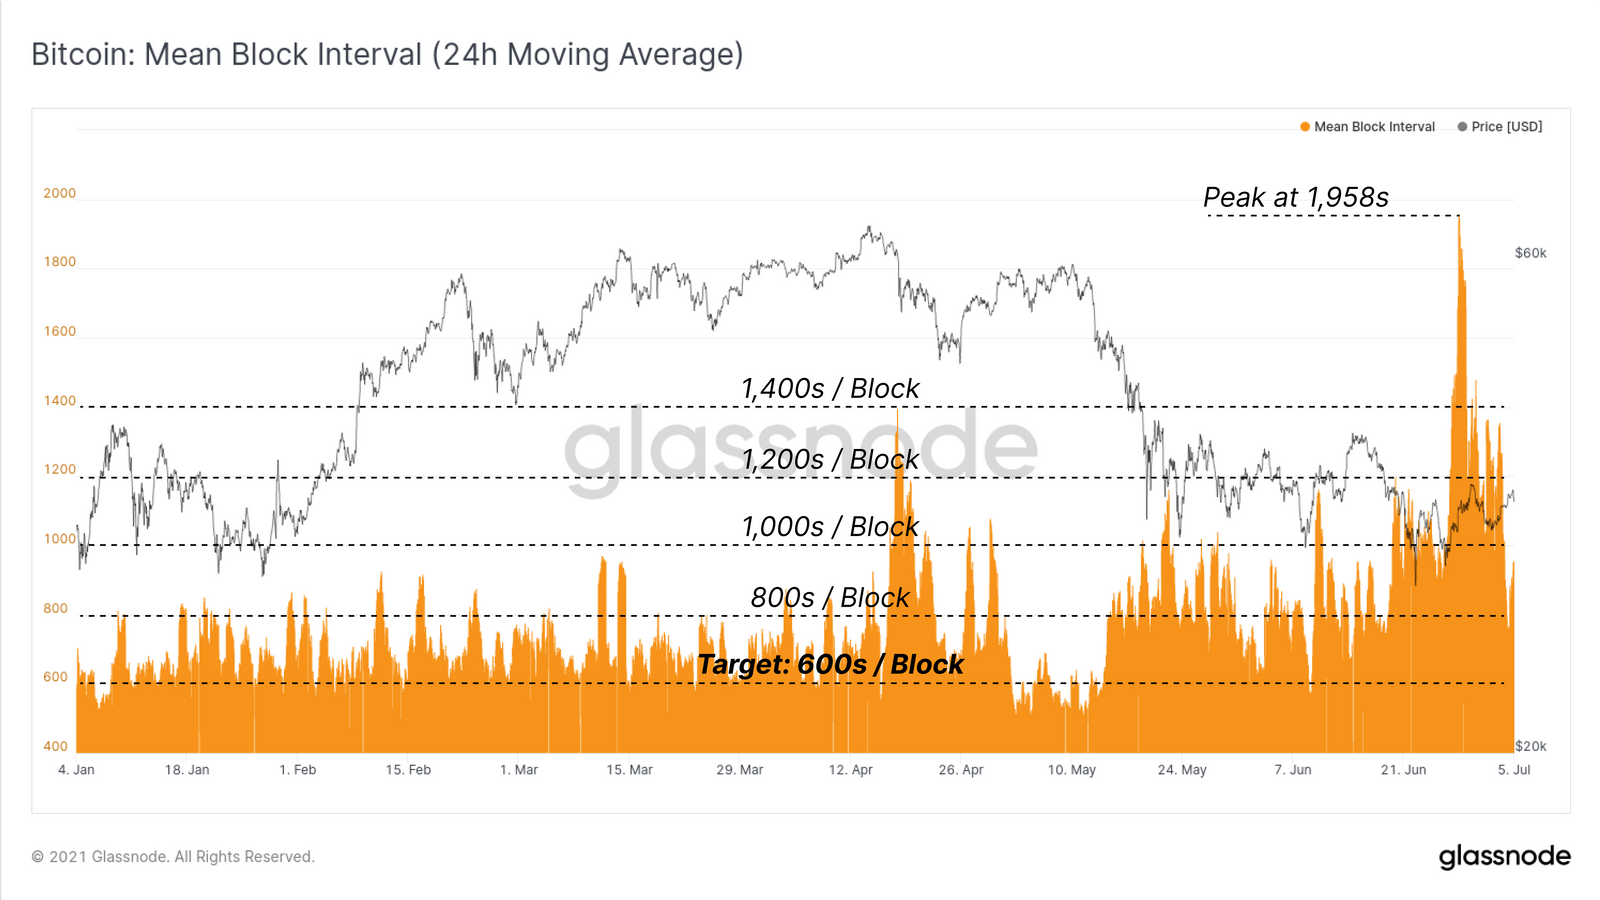
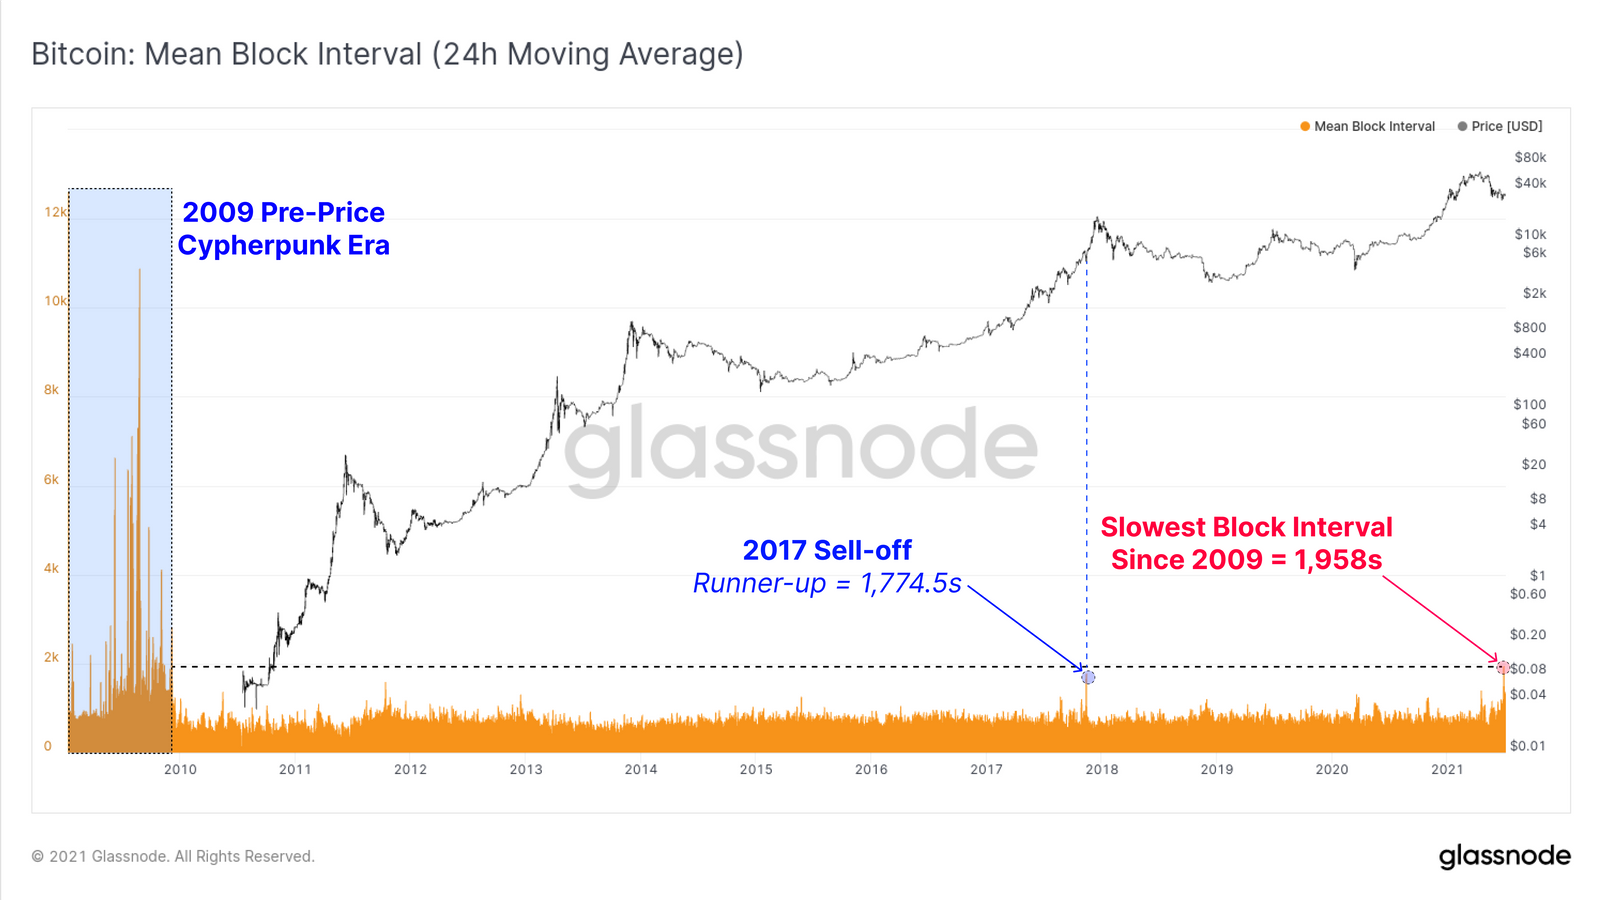
The reason why this raised an eyebrow, however, is that the last time the average block time was this high was when Bitcoin was born. Back in 2009, when BTC was not even priced yet. What’s more, this peak aligned with the dip observed by the Mean Hash Rate.
Hash Rate crash
Ordinarily, the hash rate on the network ranges from 160 EH/s to 200 EH/s, averaging at 180 EH/s. However, this week, as the avg. block time peaked, the hash rate hit a local low of 65 EH/s. Of late, the hash rate has been oscillating between 88-110 EH/s owing to the mining ban in China. But even so, the dip was estimated to be 38% – 49% below the current average. This resulted in the difficulty protocol being affected as well.

Difficulty Ribbon inverted
The difficulty ribbon displays the effects of the adjusted protocol difficulty. This week alone, at one point, difficulty had to be adjusted down by 27.94%, the largest adjustment in history. Thus, it led to the Difficulty ribbon inverting. This difficulty ribbon inversion is very uncommon and represents miner capitulation.
The reason why it’s uncommon is that such events only occur either towards the end of bear markets or after a halving.

This could be a sign that the largely speculated “bear market” we have been in is over now. That being said, this finding does not signal a rally for the coin either.