‘Technically still on a downtrend’ Bitcoin needs this to reverse its price fortunes

Bitcoin reaffirmed its king coin status recently by swiftly recovering from under $30k to touch daily highs of $32,807, before correcting once again. Now, while many might think that the aforementioned recovery was a reflex to last weekend’s declines, others are of the opinion that Elon Musk’s appearance at the “B Word” event fueled it.
Either way, Bitcoin’s price action last week displayed some truly unnerving twists and turns. On the 4-hour chart, for instance, Bitcoin’s price seemed to project bullish sentiment on the back of an 8% price hike after 21 July. Its price came up as quickly as it fell, forming a perfect V-like structure.
Furthermore, it was notable that trading volumes for the king coin saw a sustained rise alongside the price. While all of the trading volume bars were green, one green bar was notably the tallest since 23 June’s price gains.
So, is Bitcoin out of danger?
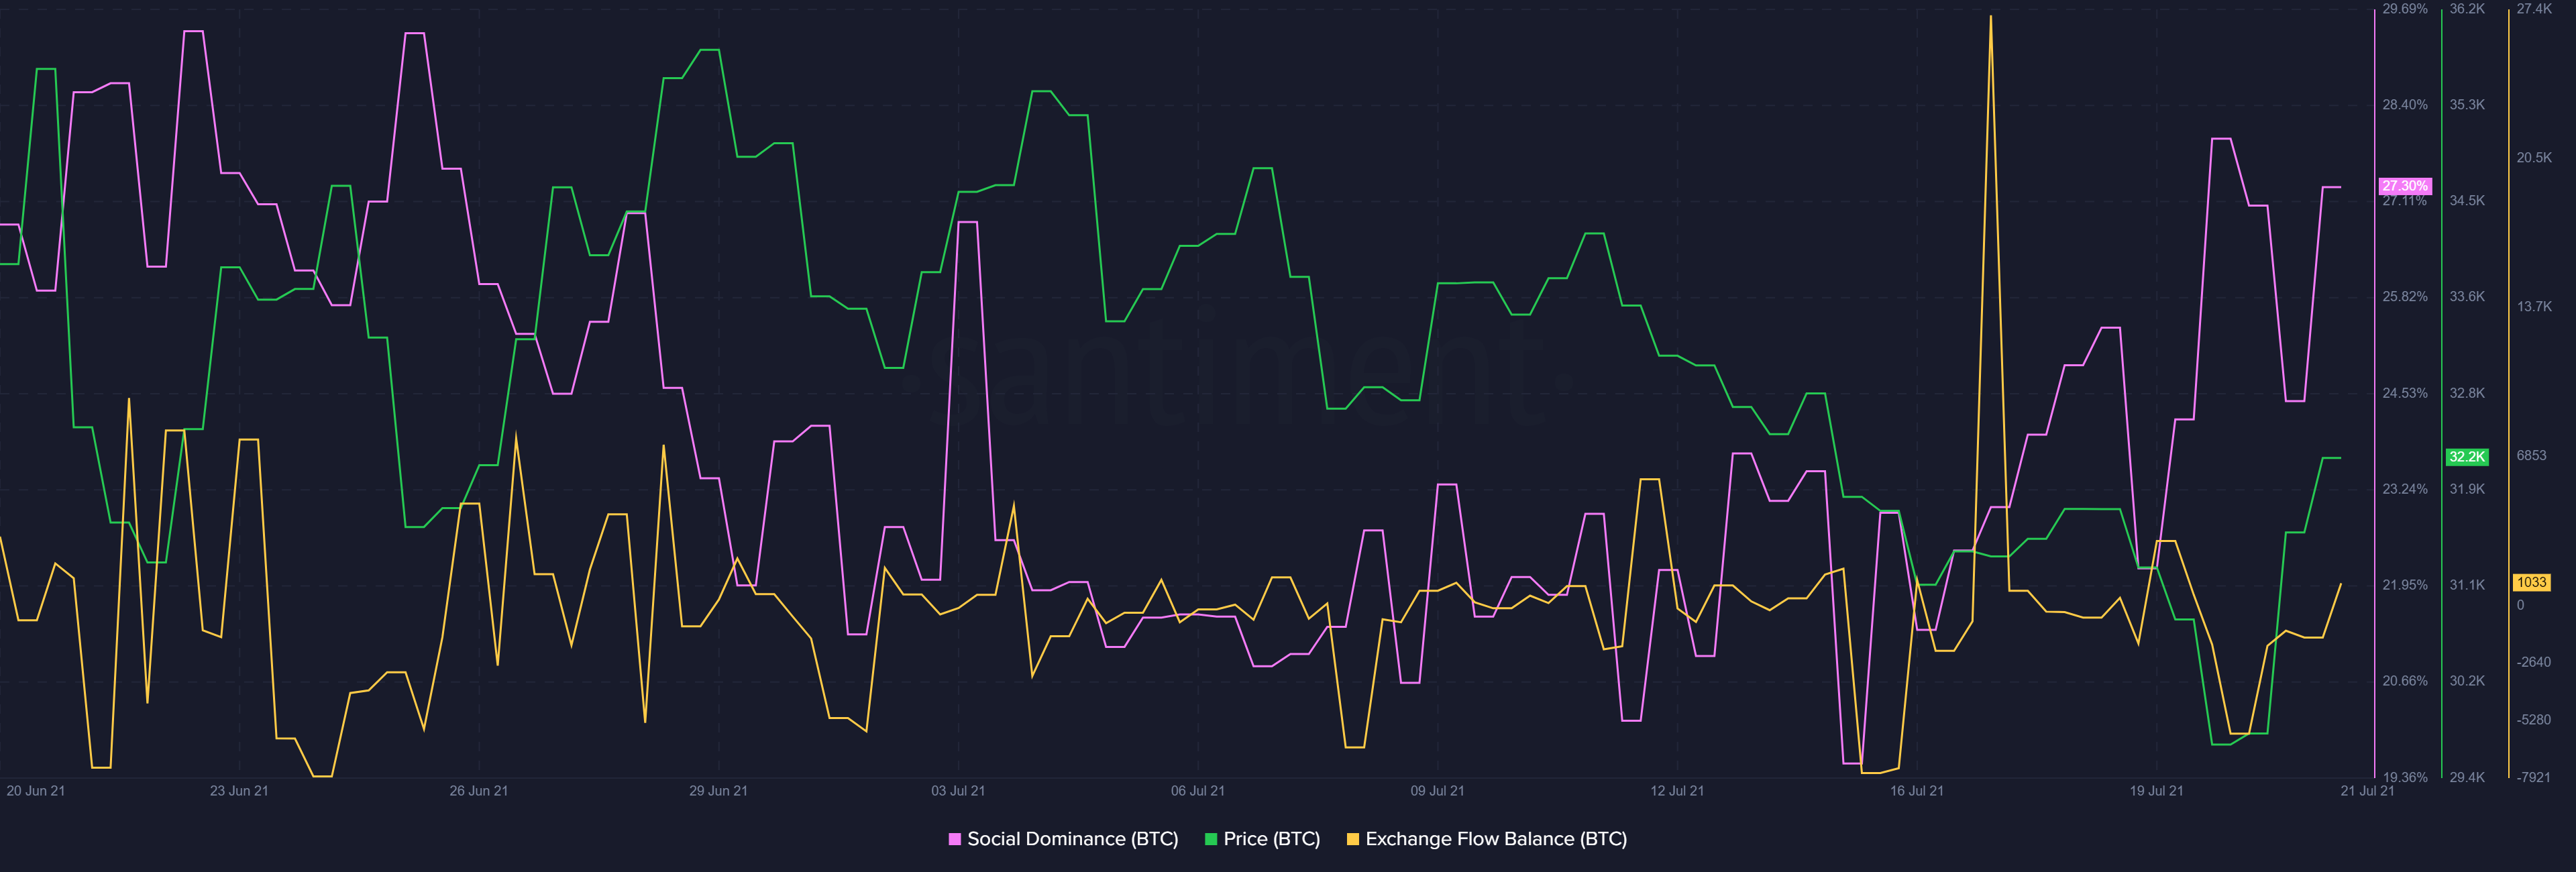
A short-term look at some key metrics like social dominance and exchange flow balance for Bitcoin suggested a healthy picture for the coin. An effective way of gauging the market sentiment surrounding a cryptocurrency is understanding its social dominance. In the case of Bitcoin, its social dominance saw a major drop on 21 July, but it soon took a U-turn and then picked up again as the price gained momentum.
Bitcoin’s exchange flow balance for all exchanges also saw an uptick suggesting a rise in market activity that was almost dormant over the last week. The flow balance turned positive after staying in the negative territory since 19 July. Further, Bitcoin’s active addresses saw a decent rise as well and stood at around 800k, at the time of writing.

Source: Sanbase
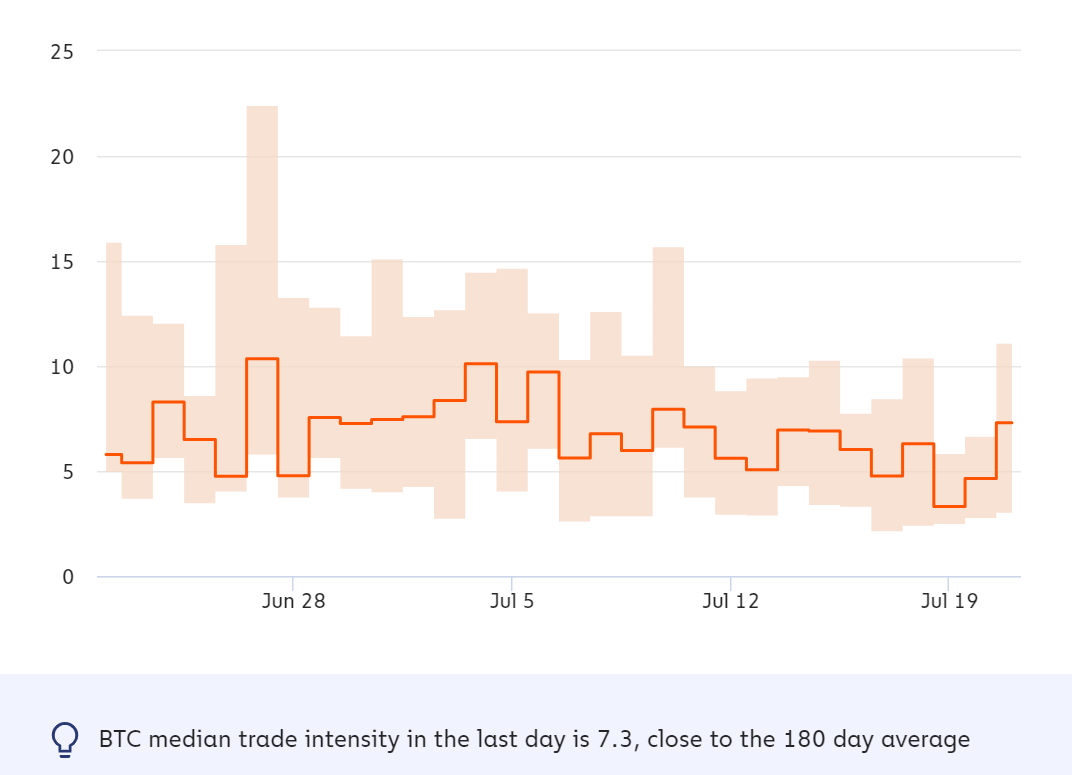
Additionally, trade intensity for the top coin, a metric that compares the value of order book trades to exchange inflows, saw an increase too – A finding which suggested that more market participants wanted to buy than to sell. These were the highest weekly trade intensity values for the cryptocurrency.

Trade Intensity Bitcoin; Source: Chainanalysis
Even though the king coin noted some decent price jumps and some healthy metric upticks, it would be too soon to conclude that it has embarked on a solid recovery phase, especially since corrections were already underway at press time.
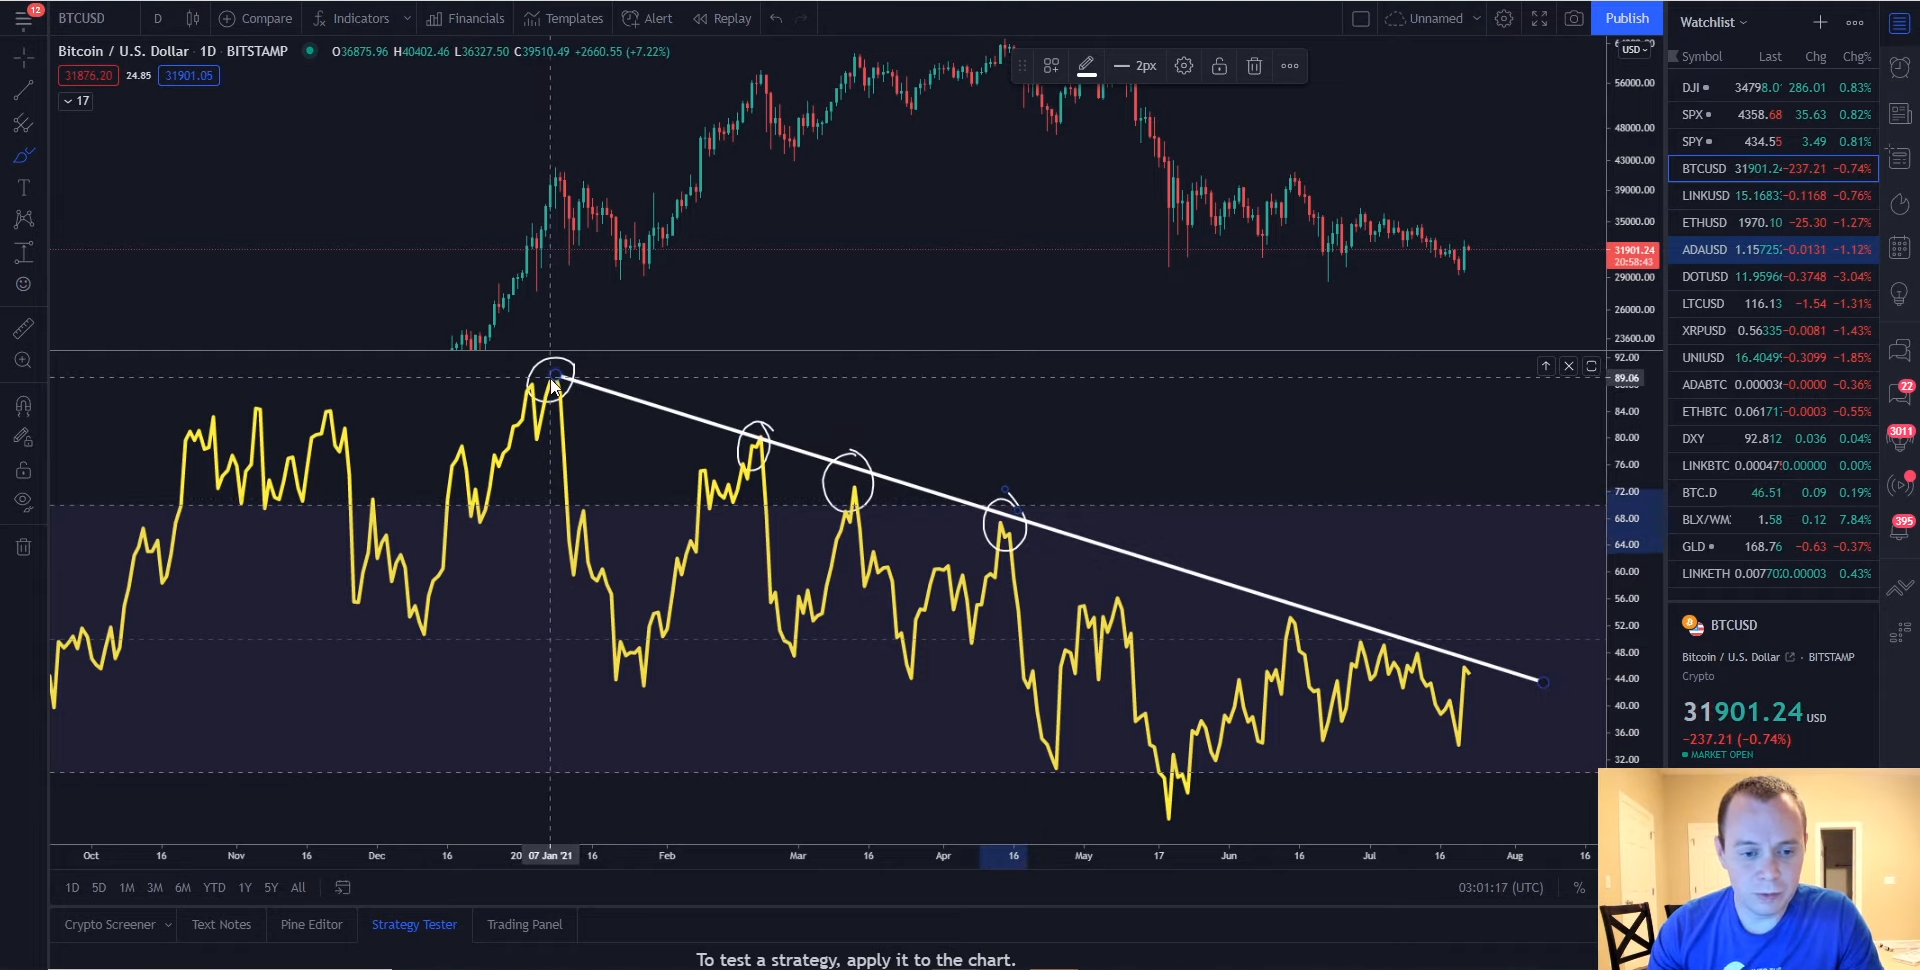
The same was highlighted by popular analyst Benjamin Cowen in a recent video. In fact, according to Cowen, “technically Bitcoin is still in a downtrend.” Underlining an interesting downtrend on the Relative Strength Index (RSI) with respect to Bitcoin’s price, he added,
“If we look at the RSI, on the daily timeframe it’s notable that there’s a general downtrend. We are registering lower highs, after lower highs, after lower highs. The first one was in January of 2021, that’s when the bulls were showing the most strength.”

BTC price with RSI; Source: Benjamin Cowen Youtube
The analyst also pointed out that even though Bitcoin made new all-time highs, they weren’t “that impressive” and with each price ATH, the RSI just made lower highs corresponding to the price.
“It has been nice to see the valuation of Bitcoin move up by almost 8% but so far, we have not broken this downtrend (of RSI)”
On the daily chart, even though Bitcoin’s RSI moved up to register an almost vertical uptick, it was still a lower high. Ergo, it would be interesting to see if it breaks past the 56.35-level. If BTC goes past the $34-35k level, an uptick in the RSI marking heavy inflows can break the aforementioned level.


